A live, structured picture of the national service
Before you can plan a national radiology service you need to know what it currently is. Site Profiles answers that: one profile per facility, kept current by the people who run it, rolled up into national dashboards.
What exists
Facilities across four regions, each with its equipment fleet — CT, MRI, ultrasound, X-ray, fluoroscopy, mammography, nuclear medicine — down to individual machines, models and schedules.
Who runs it
Staffing by role — MITs, sonographers, radiologists, trainees — as actual FTE and headcount, plus key contacts, management and clinical teams for every site.
What depends on it
The hierarchy, rosters and user accounts feed the wider suite: Service Sizing syncs its facility and staffing data straight from here, and users carry one login across both apps.
How the registry is organised
Three ideas do most of the work: the geographic hierarchy, facility archetypes, and satellite sites.
The hierarchy
Everything hangs off the four health regions. This tree is the canonical one — Service Sizing's grains sit on top of it.
Archetypes
Each facility is classed from XL (tertiary centre) to XS (small rural site). Archetypes drive the map display, comparisons, and sensible defaults downstream in Service Sizing.
Satellite sites
Smaller facilities that share a staffing pool with a parent hospital are marked as satellites. They inherit the parent's FTE data automatically (view-only on the satellite), so shared staff are never counted twice. Typical cases: rural hospitals under a main centre, attached outpatient clinics, mobile services.
Specialty service tags
Profiles carry tags for the advanced services a site actually operates — used for referral planning and national capability mapping.
Tags follow the current-reality rule too — only services that are operational today.
Every screen, and what it's for
The app splits into national views, per-facility profiles, dashboards, and a set of tools. Here's the surface, top to bottom.
National Map
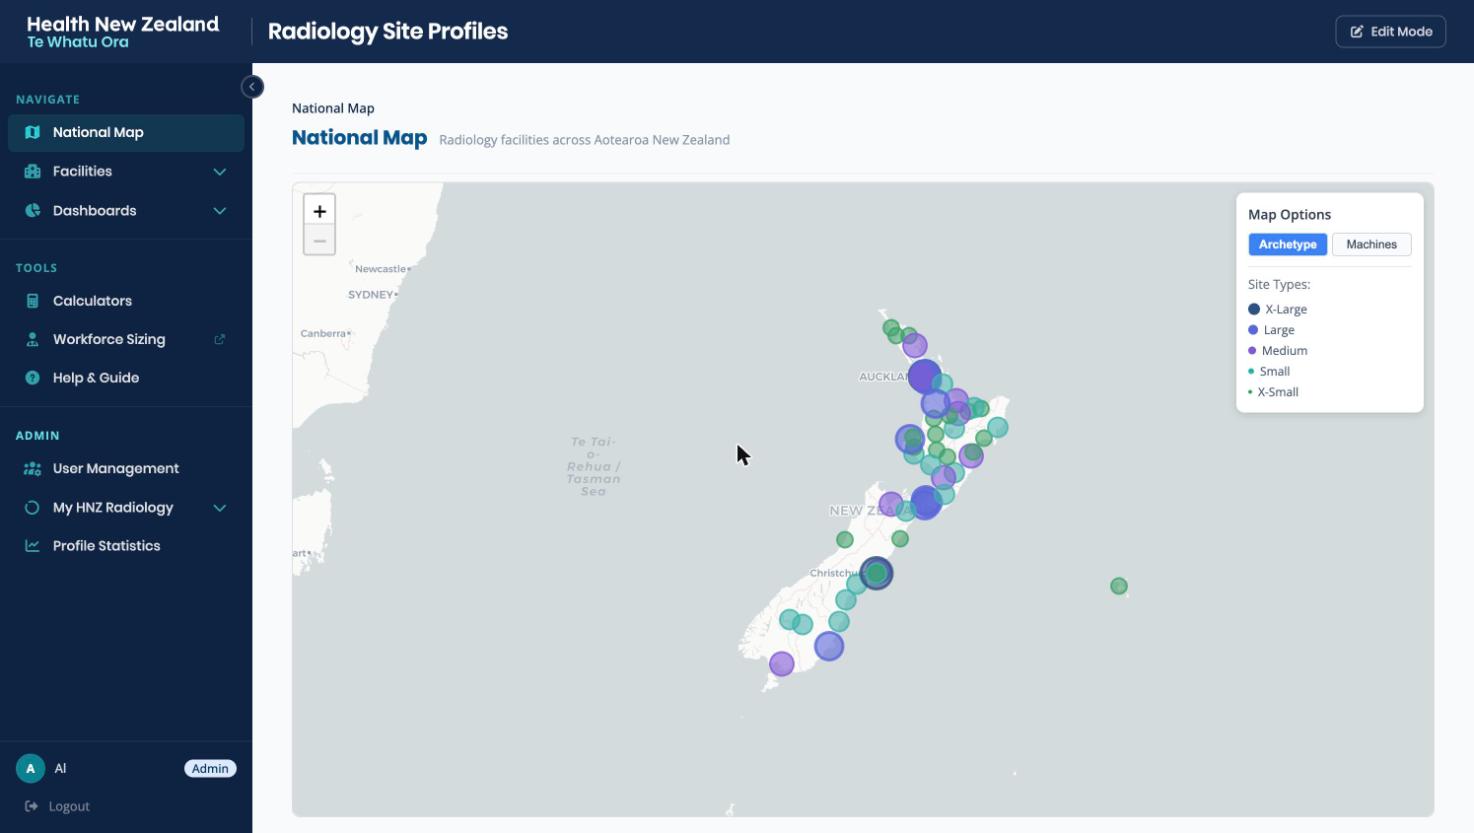
Every facility plotted on a map of Aotearoa, sized and coloured by archetype, with a second lens that switches the display to machine counts. The fastest way to get a feel for how the national service is distributed.
- Archetype and Machines display modes
- Click through from any marker to the facility profile
- The natural starting point for newcomers to the network
Facility lists
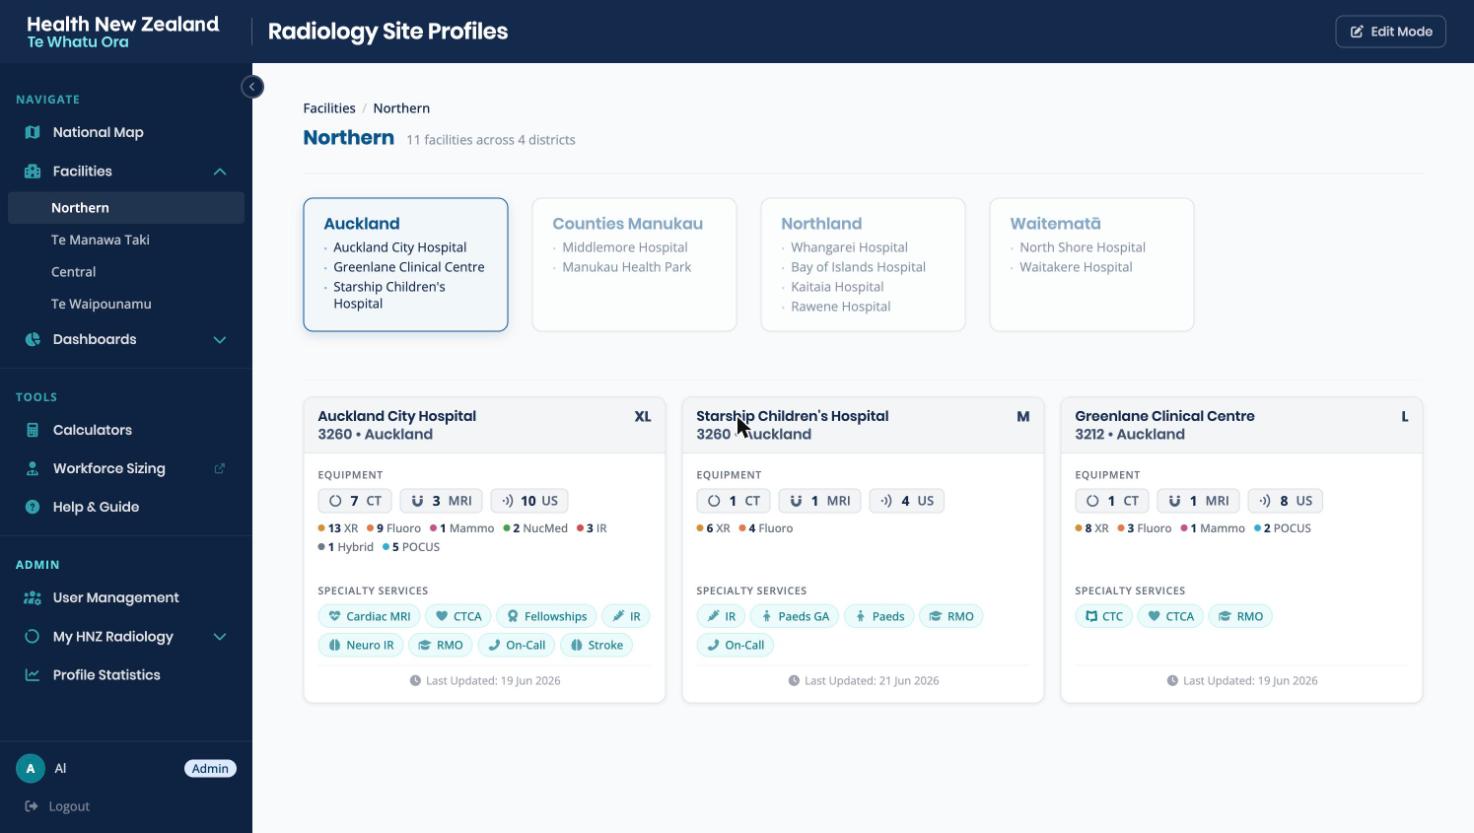
Each region has a browsable list, grouped by district. Every card is a mini-profile: equipment counts by modality, specialty service tags, and the last-updated date so stale data is visible immediately.
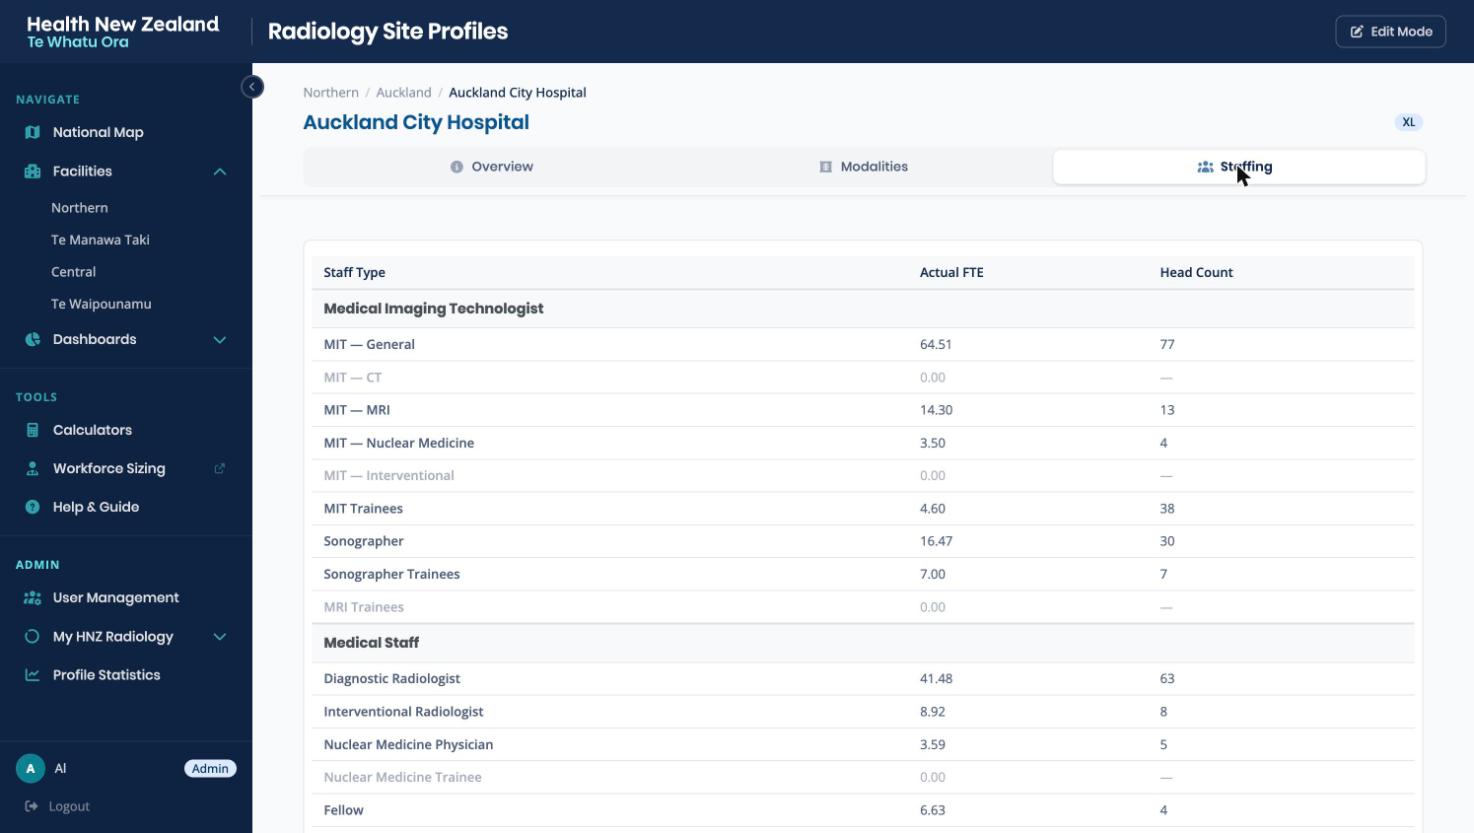
Open any facility and you get a three-tab profile: Overview, Modalities and Staffing. This is where editors do most of their work.
Overview
The site's identity card: site code, district and region, archetype, address and phone, plus the management and clinical teams — clinical manager, charge MIT, modality leads — each with contact details. Hover tooltips on field labels explain exactly what belongs in each field.
- Who to call, for any site in the country
- Parent-site dropdown for satellite relationships
- Specialty service tags live here too
Modalities
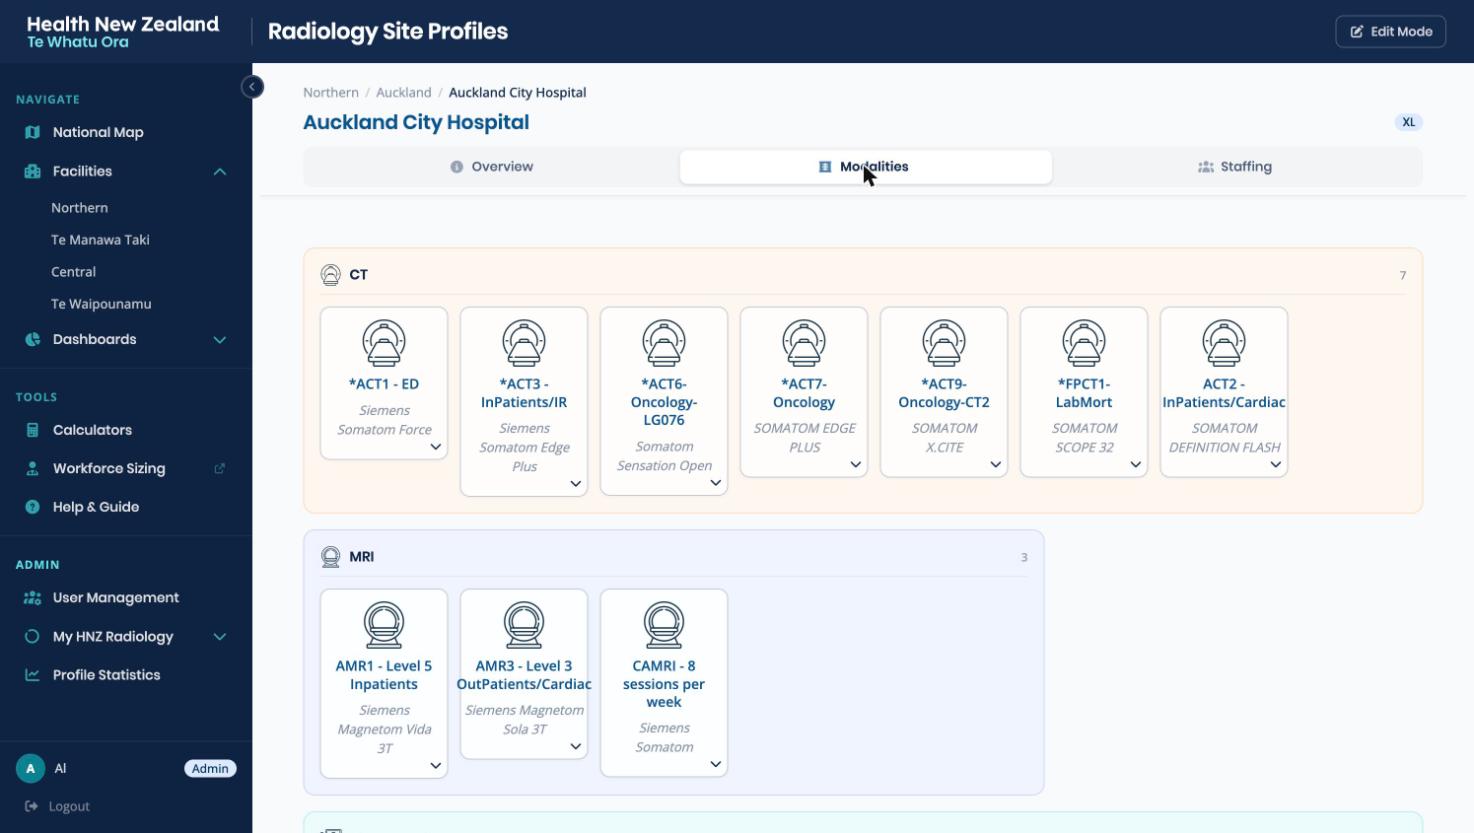
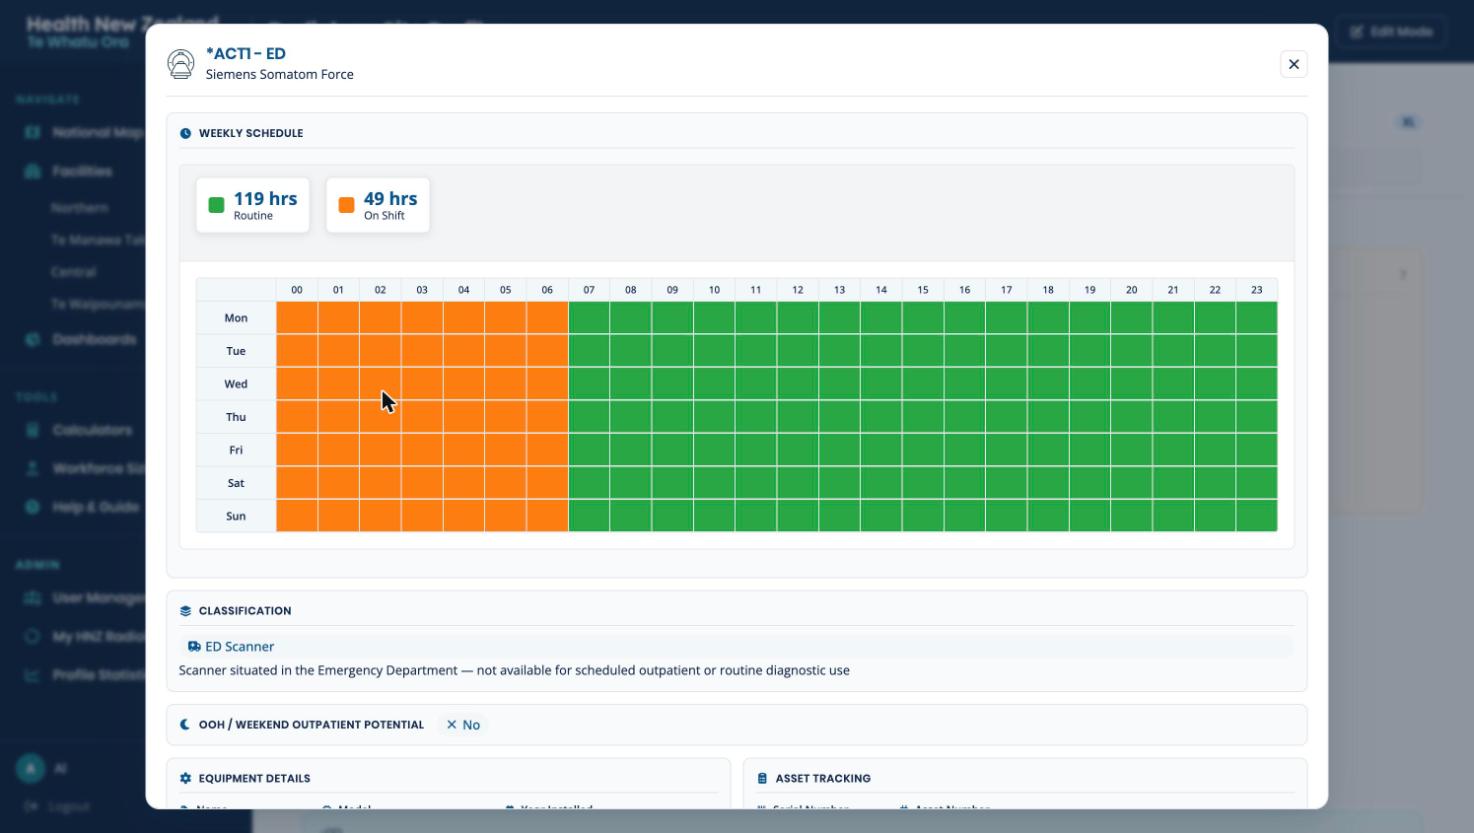
The machine fleet, grouped by modality. Each card is an individual machine with its name, model, and an expandable detail view covering classification, equipment details, asset tracking and its weekly schedule.
Staffing
Actual FTE and headcount for every staff type — MITs by modality, trainees, sonographers, then medical staff: diagnostic and interventional radiologists, nuclear medicine physicians, fellows and more.
- Actual numbers, not budgeted aspirations — the current-reality rule again
- Satellite sites display the parent's shared pool, read-only
- These rosters are what Service Sizing syncs as its workforce baseline
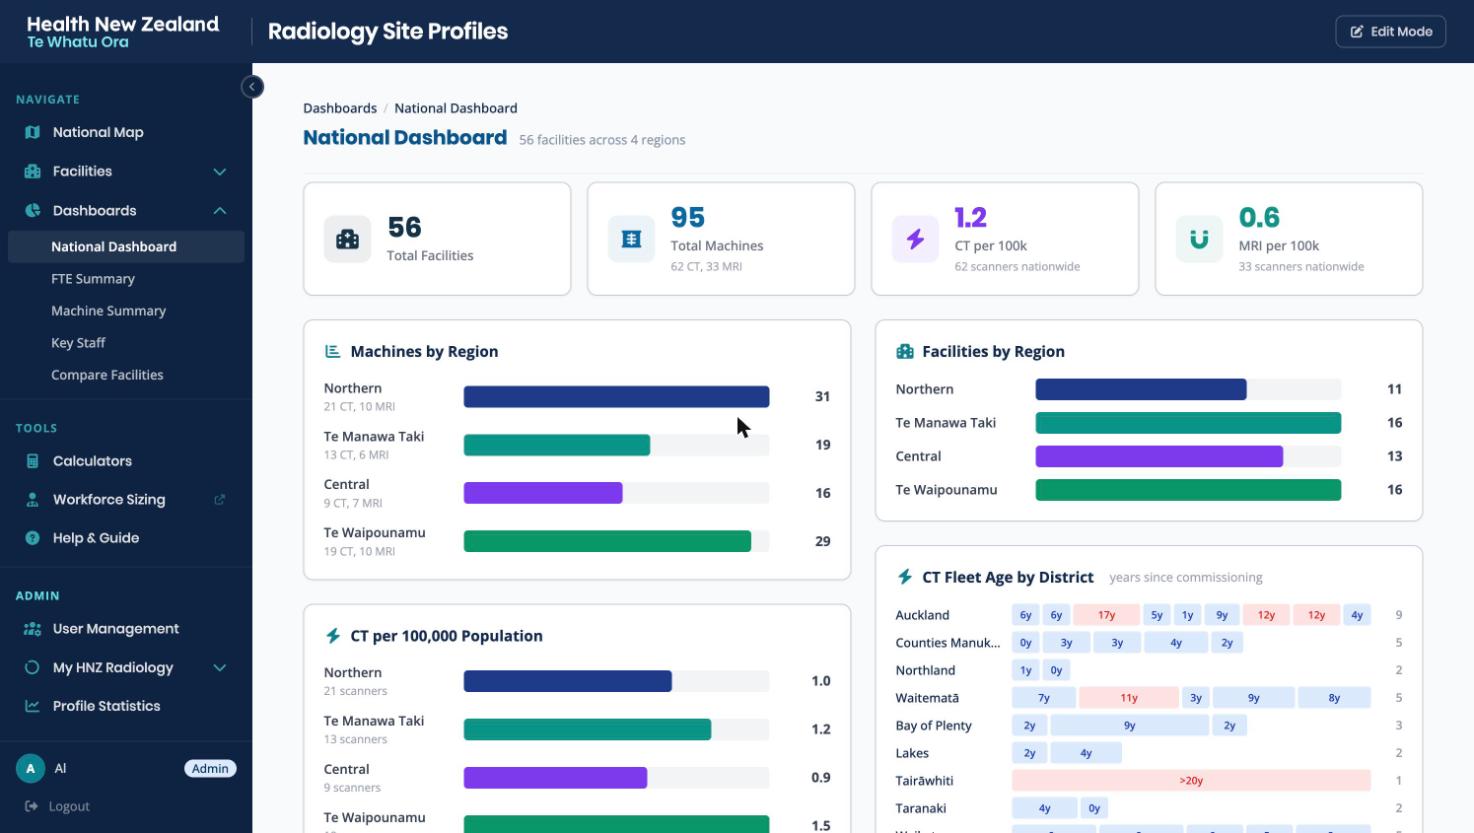
National Dashboard
The registry aggregated: total facilities and machines, CT and MRI per 100,000 population, machines and facilities by region, and fleet age by district — with older scanners flagged so replacement planning has an evidence base.
FTE Summary
Staffing rolled up by region and district, expandable down to facility level, with population context and Excel export for offline analysis.
Machine Summary
The national fleet as a sortable inventory — every machine, model, age and schedule totals, filterable by modality and region.
Key Staff
A directory of leadership and key contacts across all sites — clinical managers, modality leads and charge MITs in one searchable place.
Compare Facilities
Pick facilities and see their equipment, staffing and services in aligned columns — the quickest way to benchmark similar sites.
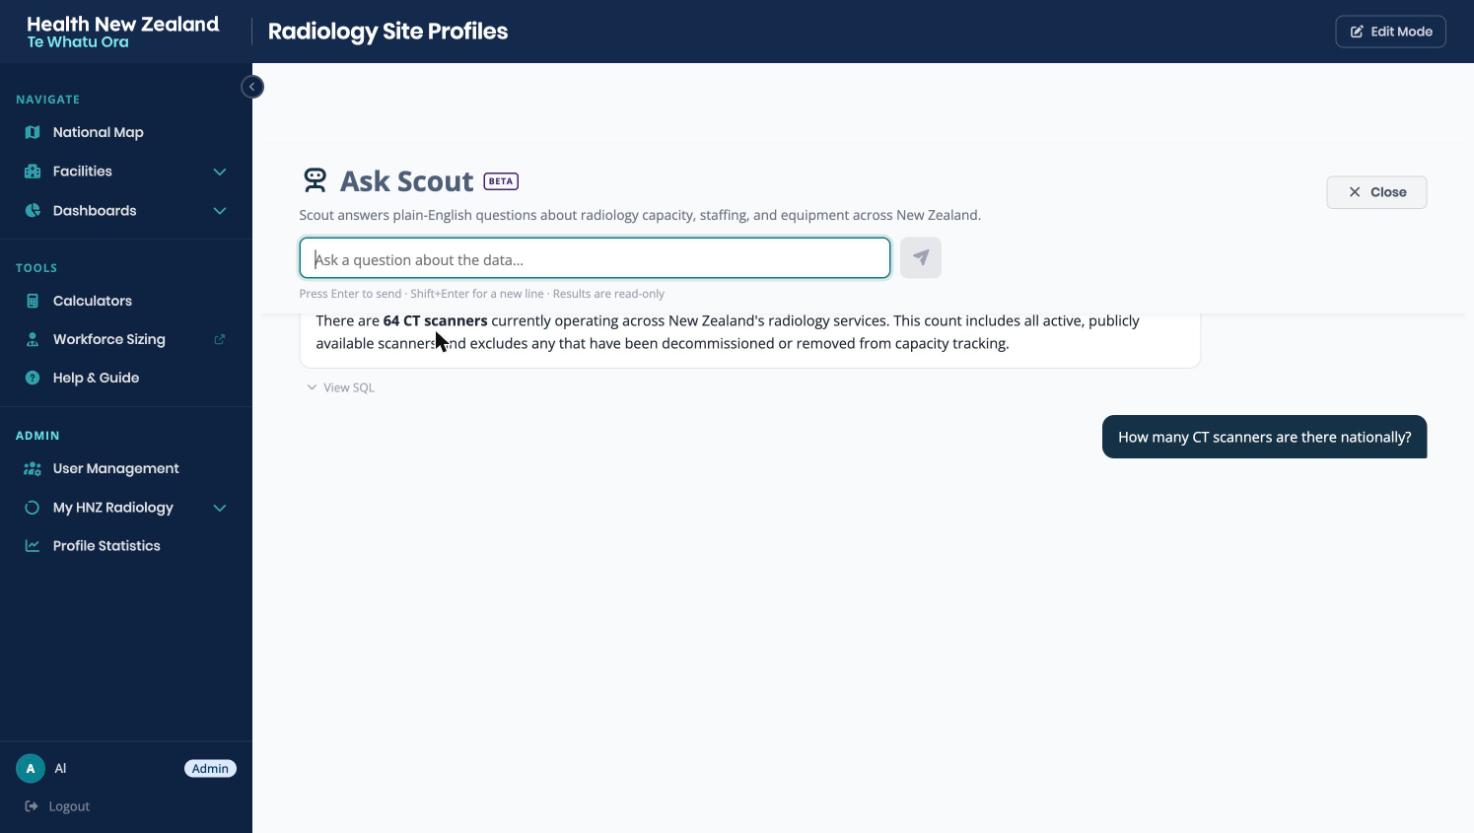
Ask Scout
Scout answers plain-English questions about the registry — no SQL required. Ask "how many CT scanners are there nationally?" or "which facilities have unfilled radiologist positions?" and it queries the live database and answers in prose.
- Strictly read-only — Scout can never change a profile
- Every answer has a View SQL toggle showing the exact query it ran
- Asks a clarifying question with clickable options when the request is ambiguous
Calculators
Working tools for planners — quick capacity and staffing calculations grounded in the registry's own data.
Edit Mode
Editors flip one switch and every profile becomes editable in place. Changes save immediately and are attributed in the audit log — there's no draft state, so the rule is review before you save.
The people registry & network comms
Site Profiles has grown a second role: the workforce registry and communication hub for the national radiology network — branded My HNZ Radiology.
SMO & RMO registry
A national register of radiologists — specialties, training status, leadership roles, profile photos — with self-service profile confirmation via emailed links, so the data is maintained by the people it describes.
MRT register & network members
The same treatment for MITs and for other network members — programme leads, consumer/whānau voice representatives, network managers — so the whole network is addressable in one place.
Broadcasts
Targeted announcements from the network to registered members — filtered by role, specialty or region, delivered by email with tracked receipts, and shown in the radiologist portal.
Freshness watch
Every change lands in an audit log, and a weekly job emails regional leads about profiles going stale — the mechanism that keeps "current reality" actually current.
Built on the edge
The whole app runs on Cloudflare's stack — no servers to maintain, fast from anywhere in the country.
Frontend
React + TypeScript · Vite · Cloudflare Pages
- Single-page app with route-per-view
- Region/district/facility routing mirrors the hierarchy
- HNZ design system styling
Backend
Cloudflare Pages Functions · D1 (SQLite) · R2
- D1 relational database, schema managed by numbered migrations
- R2 object storage for images and files
- Custom JWT auth (HMAC-SHA256), PBKDF2 passwords, rate limiting
- Transactional email via Resend; weekly stale-notify worker
Who can do what
Three roles, optionally scoped by region. Admins can also be regional leads — the people the freshness watch reports to.
| Capability | Viewer | Editor | Admin |
|---|---|---|---|
| Browse map, profiles & dashboards | |||
| Ask Scout & calculators | |||
| Edit facility profiles | — | ||
| Manage users & permissions | — | — | |
| Workforce registries & broadcasts | — | — | (with registry / broadcast permissions) |
| Profile statistics & audit | — | — |