A demand-driven workforce model for radiology
HNZ Radiology Service Sizing answers the question: given the work that comes through the door, how many Senior Medical Officer FTE does it take to do it — and how does that compare to current staffing?
Demand in
Examination volumes by modality and complexity, plus the fixed clinical work that isn't reporting — meetings, procedures, training, supervision.
Engine
A transparent calculation converts that work into clinical hours, then into a required FTE figure using each service's own leave and non-clinical assumptions.
Gap out
Required FTE minus effective FTE on the roster gives a gap — flagged as understaffed, adequate or overstaffed, and rolled up from grain to district, region and nation.
The vocabulary of the model
A handful of ideas carry the whole tool. Get these and every screen makes sense.
The hierarchy
Everything hangs off a national tree. Regions and districts come from the companion site-profiles registry; the grain is Service Sizing's own unit.
The grain
A grain is a planning unit — a coherent slice of radiology service that maps to one or more physical facilities. It's where all the inputs live: activity profiles, FTE parameters, demand volumes and staffing. Calculations happen at grain level, then aggregate upward. Satellite facilities merge into their parent grain.
Archetypes
Each grain is sized into an archetype from XL to XS. Archetypes drive sensible default templates so a small rural service isn't configured from a blank page.
Modalities
Demand is counted per imaging modality. Each modality–complexity pairing carries a time constant — minutes per report — that converts volume into reporting workload.
CT, MR, Ultrasound, X-Ray, Nuclear Medicine, Mammography and Fluoroscopy.
Reporting vs. CNR
SMO time splits into two streams. Reporting scales with examination volume. Everything else is Clinical Non-Reporting — CNR — grouped into four categories.
Reporting hours come from volume × time constant. CNR 1–4 are summed as a fixed hours budget. Non-clinical time is handled separately as a percentage allowance — its activities are tracked for audit but don't add to the calculated hours.
From examinations to an FTE gap
This is the heart of the tool. The whole method is deliberately legible — every number can be traced back to an input. Here's the chain.
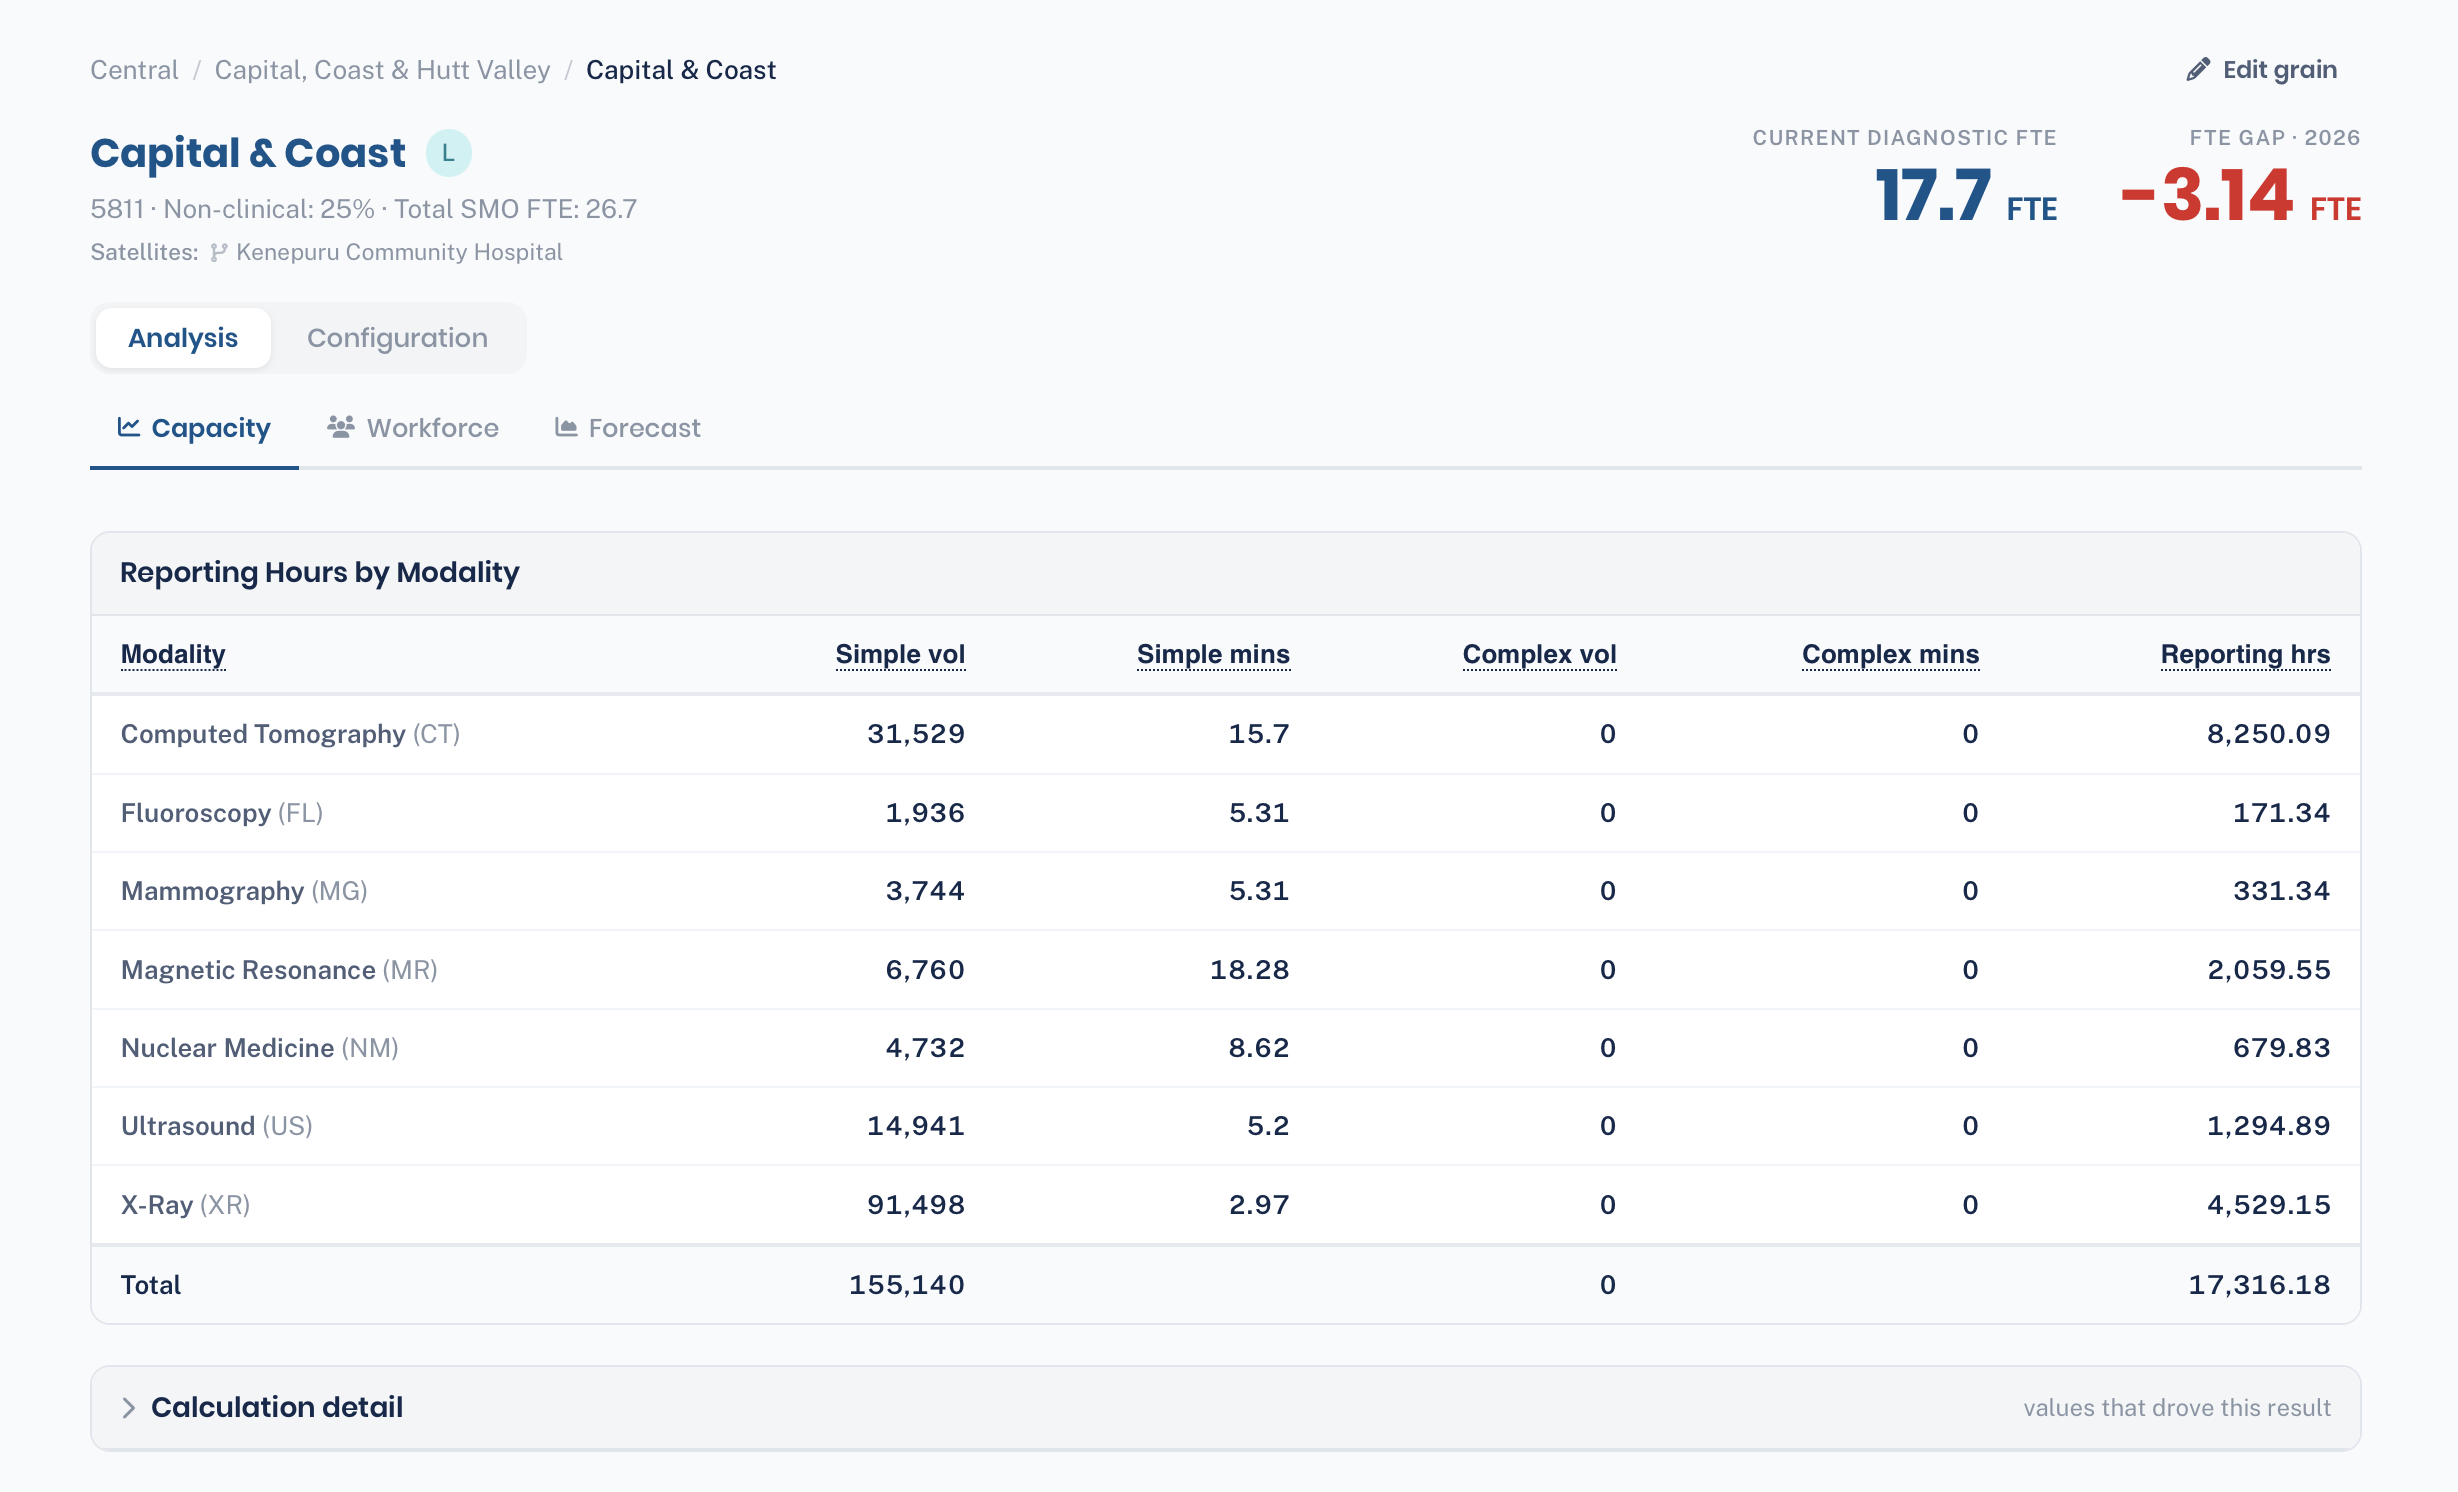
Reporting workload
For every modality and complexity, multiply annual volume by its time constant (minutes per report), then convert to hours.
Fixed non-reporting workload (CNR)
Sum the hours from CNR categories 1–4 — conferences, procedures, training, other — and add the preparation and attendance hours for every MDM / recurring meeting.
Clinical hours available per FTE
Start from standard annual hours, subtract leave (annual, public holidays, training, sick, other) to get productive hours, then remove the non-clinical percentage.
Required FTE and the gap
Total the clinical hours needed, divide by the hours one FTE delivers, and compare to effective FTE — diagnostic SMO FTE, less on-call, plus the interventional allocation that contributes to reporting.
Try it yourself
Move the sliders. This calculator runs the exact chain above, with the same default assumptions the app ships with (2,086 standard hours; 240 / 96 / 80 / 60 hours of leave). It's a teaching model — the real app pulls every figure from a grain's saved configuration.
Inputs
Result
Every screen, and what it's for
The app has two top-level views, a per-grain workspace split into Analysis and Configuration tabs, and a set of admin tools. Here's the whole surface.
National Overview
The home screen. A national roll-up of capacity status across every grain — total grains, aggregate required vs. effective FTE, and how many services sit understaffed, adequate or overstaffed.
- At-a-glance national workforce position
- Status distribution to spot pressure points fast
- Jumping-off point into any region, district or grain
Compare Grains
Put several grains next to each other and compare the numbers that matter — required FTE, current FTE, the gap, reporting hours, CNR hours and assumptions — in aligned columns.
- Benchmark similar archetypes against each other
- Sense-check why two services land differently
- Build the evidence line for a business case
Open any grain and you land in the Analysis group — the calculated outputs. These are read-only results, not inputs.
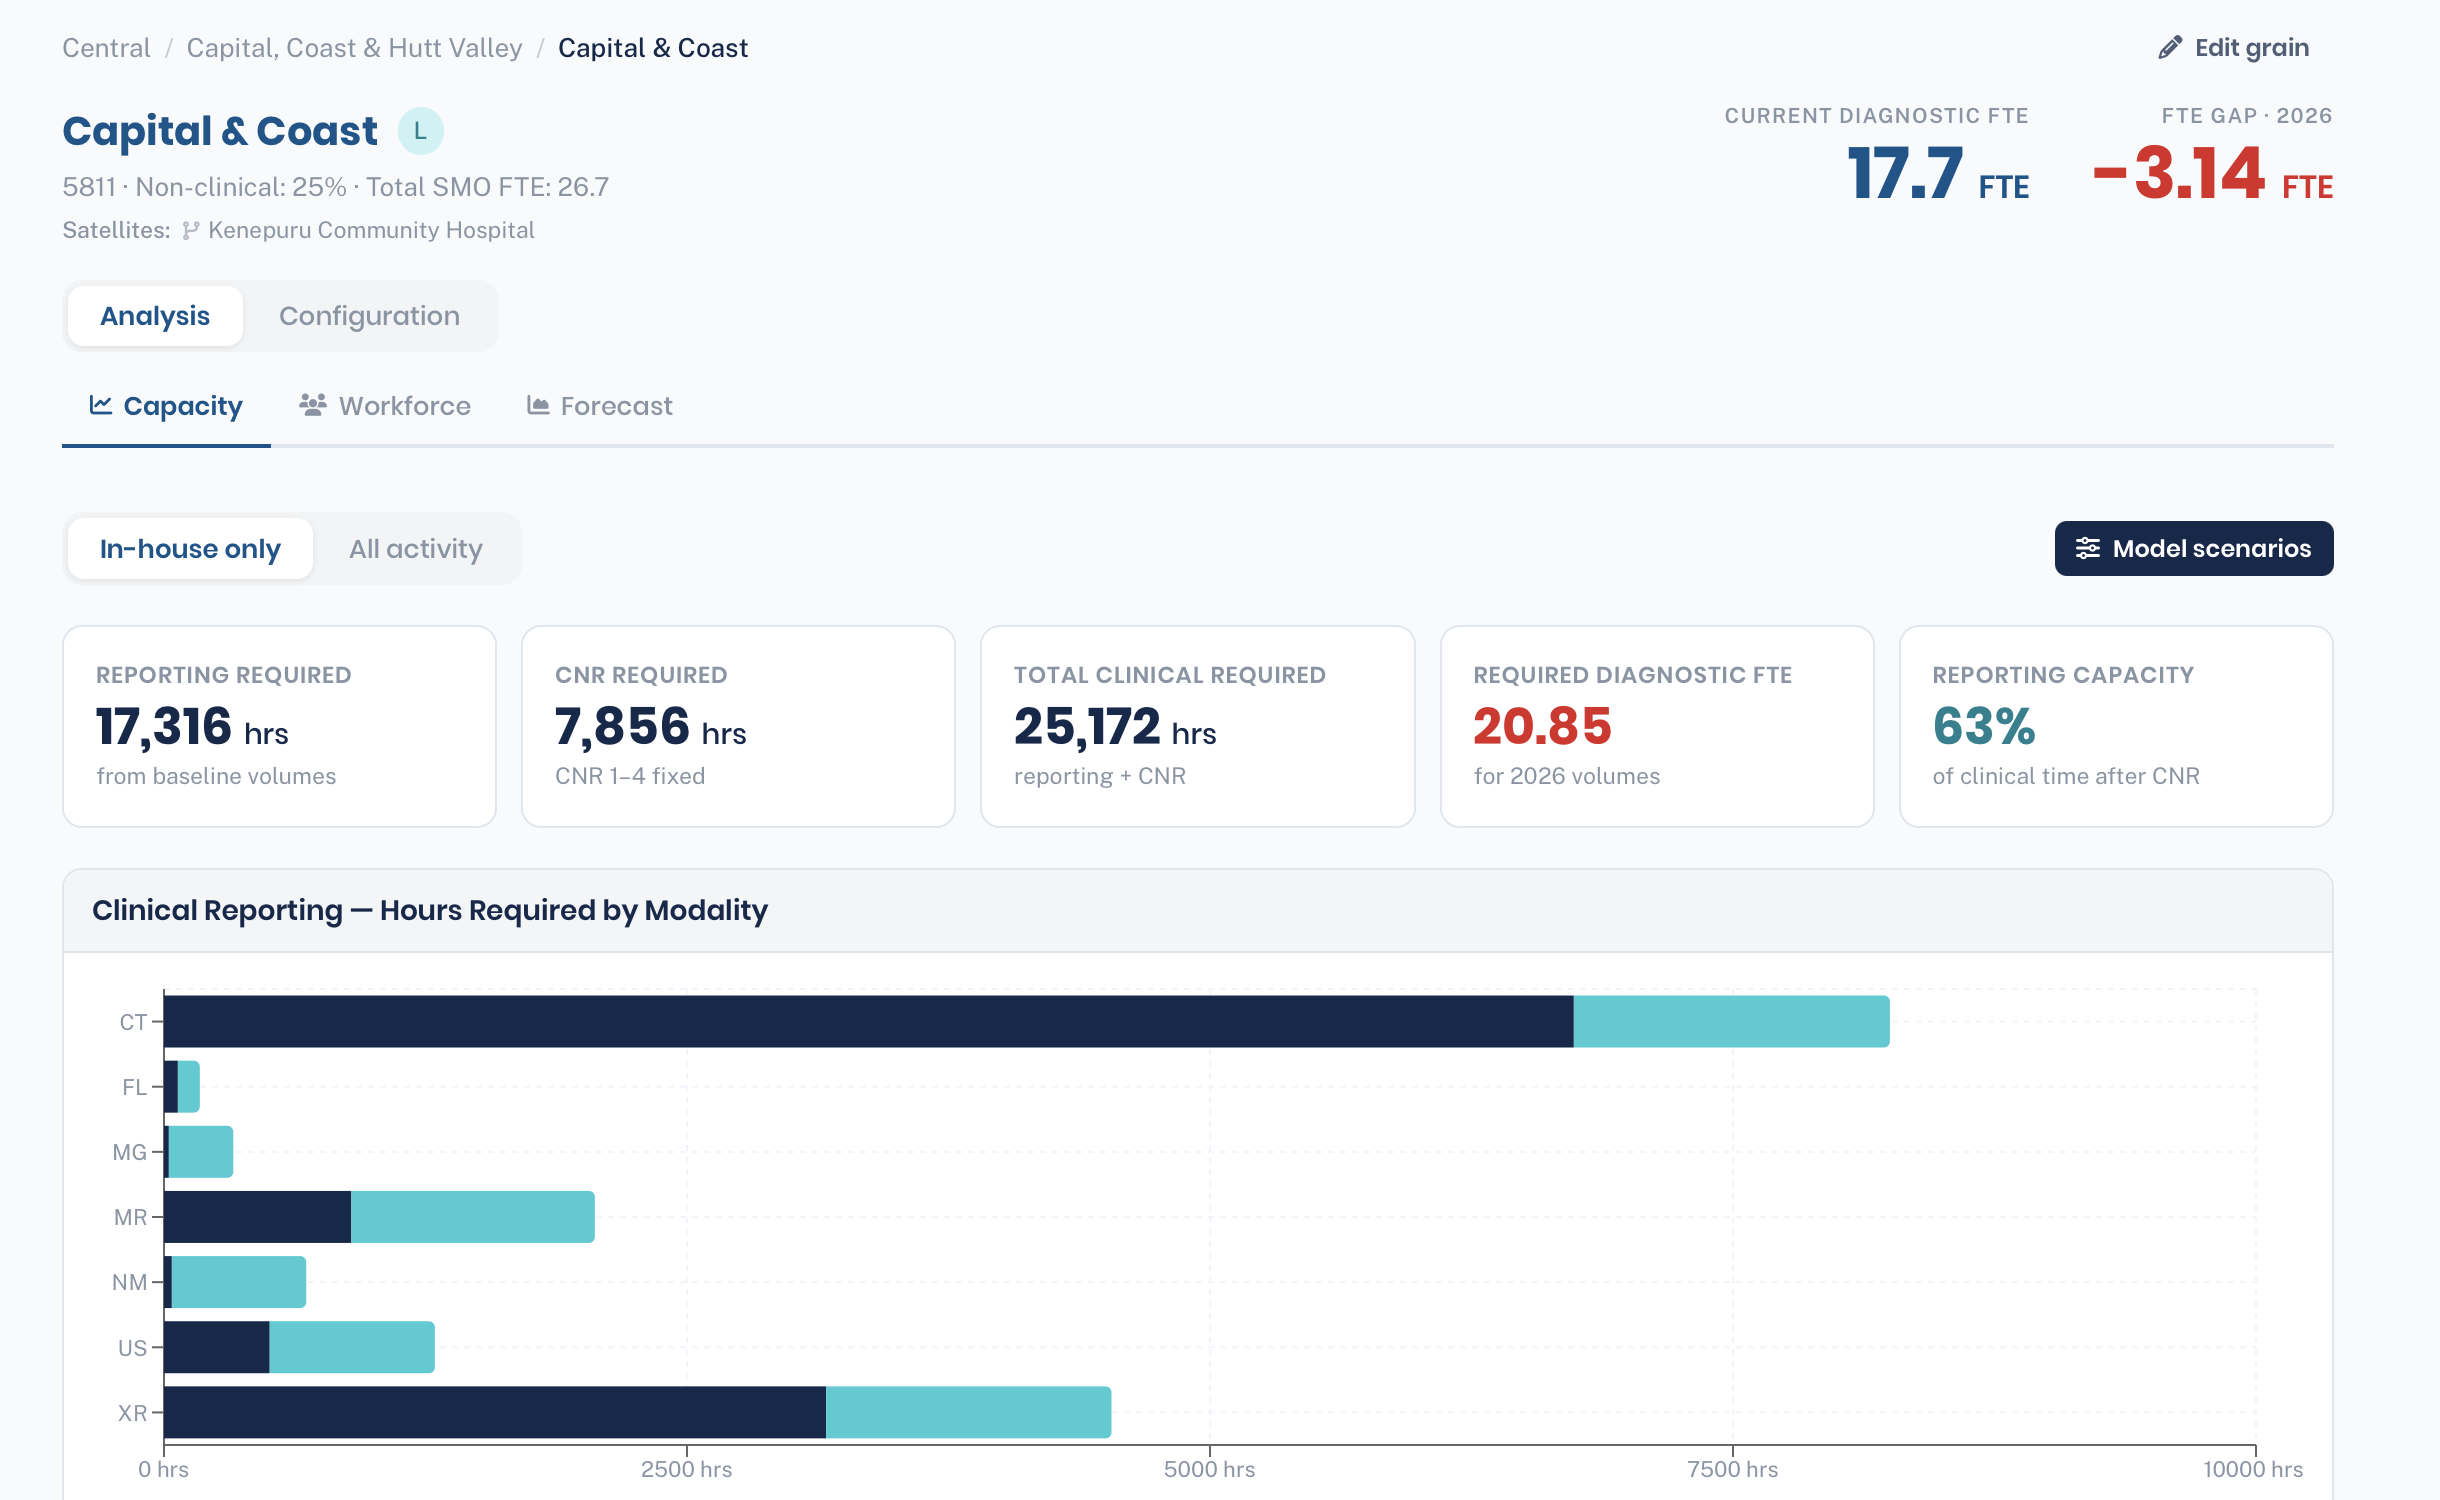
Capacity
The grain's headline result, and the screen you'll check most. The large numbers at the top are Required Diagnostic FTE against Current Diagnostic FTE, with the gap between them. The five cards below open the requirement up: Reporting Required, CNR Required and Total Clinical Required (all in hours), plus Required Diagnostic FTE and Reporting Capacity %.
- Use the In-house only / All activity toggle to switch between work read in-house and the repatriation view — in-house plus outsourced volumes combined.
- Reporting Capacity % is the share of clinical time left for reporting once CNR is removed; a low figure means meetings and procedures are consuming the service.
- If a number looks wrong, open Calculation detail or revisit the grain's volumes and FTE config — every figure traces back to an input.
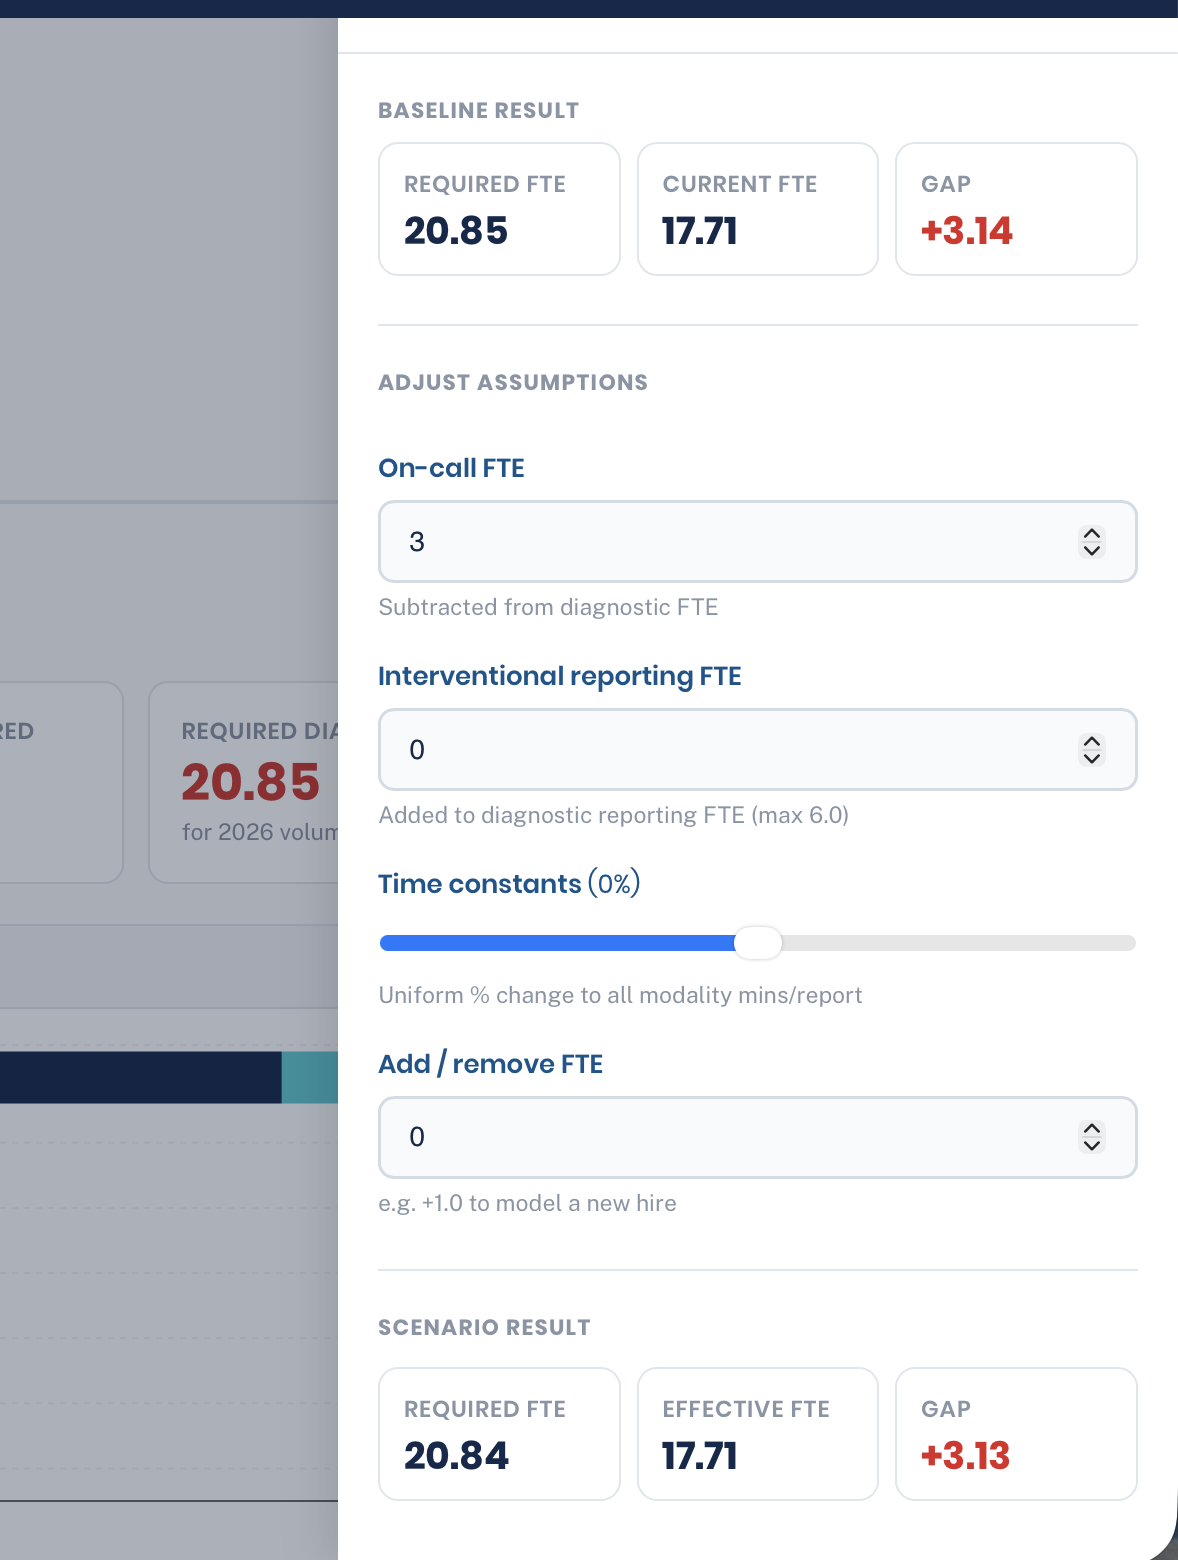
Model Scenarios
A what-if drawer launched from the Capacity tab. It shows the baseline result, then lets you pull four levers and watch a live scenario result update beside it — without touching the grain's saved configuration.
- On-call FTE — how much is subtracted from diagnostic capacity
- Interventional reporting FTE — how much IR time is added back
- Time constants — a uniform % shift to all minutes-per-report
- Add / remove FTE — model a new hire or a vacancy
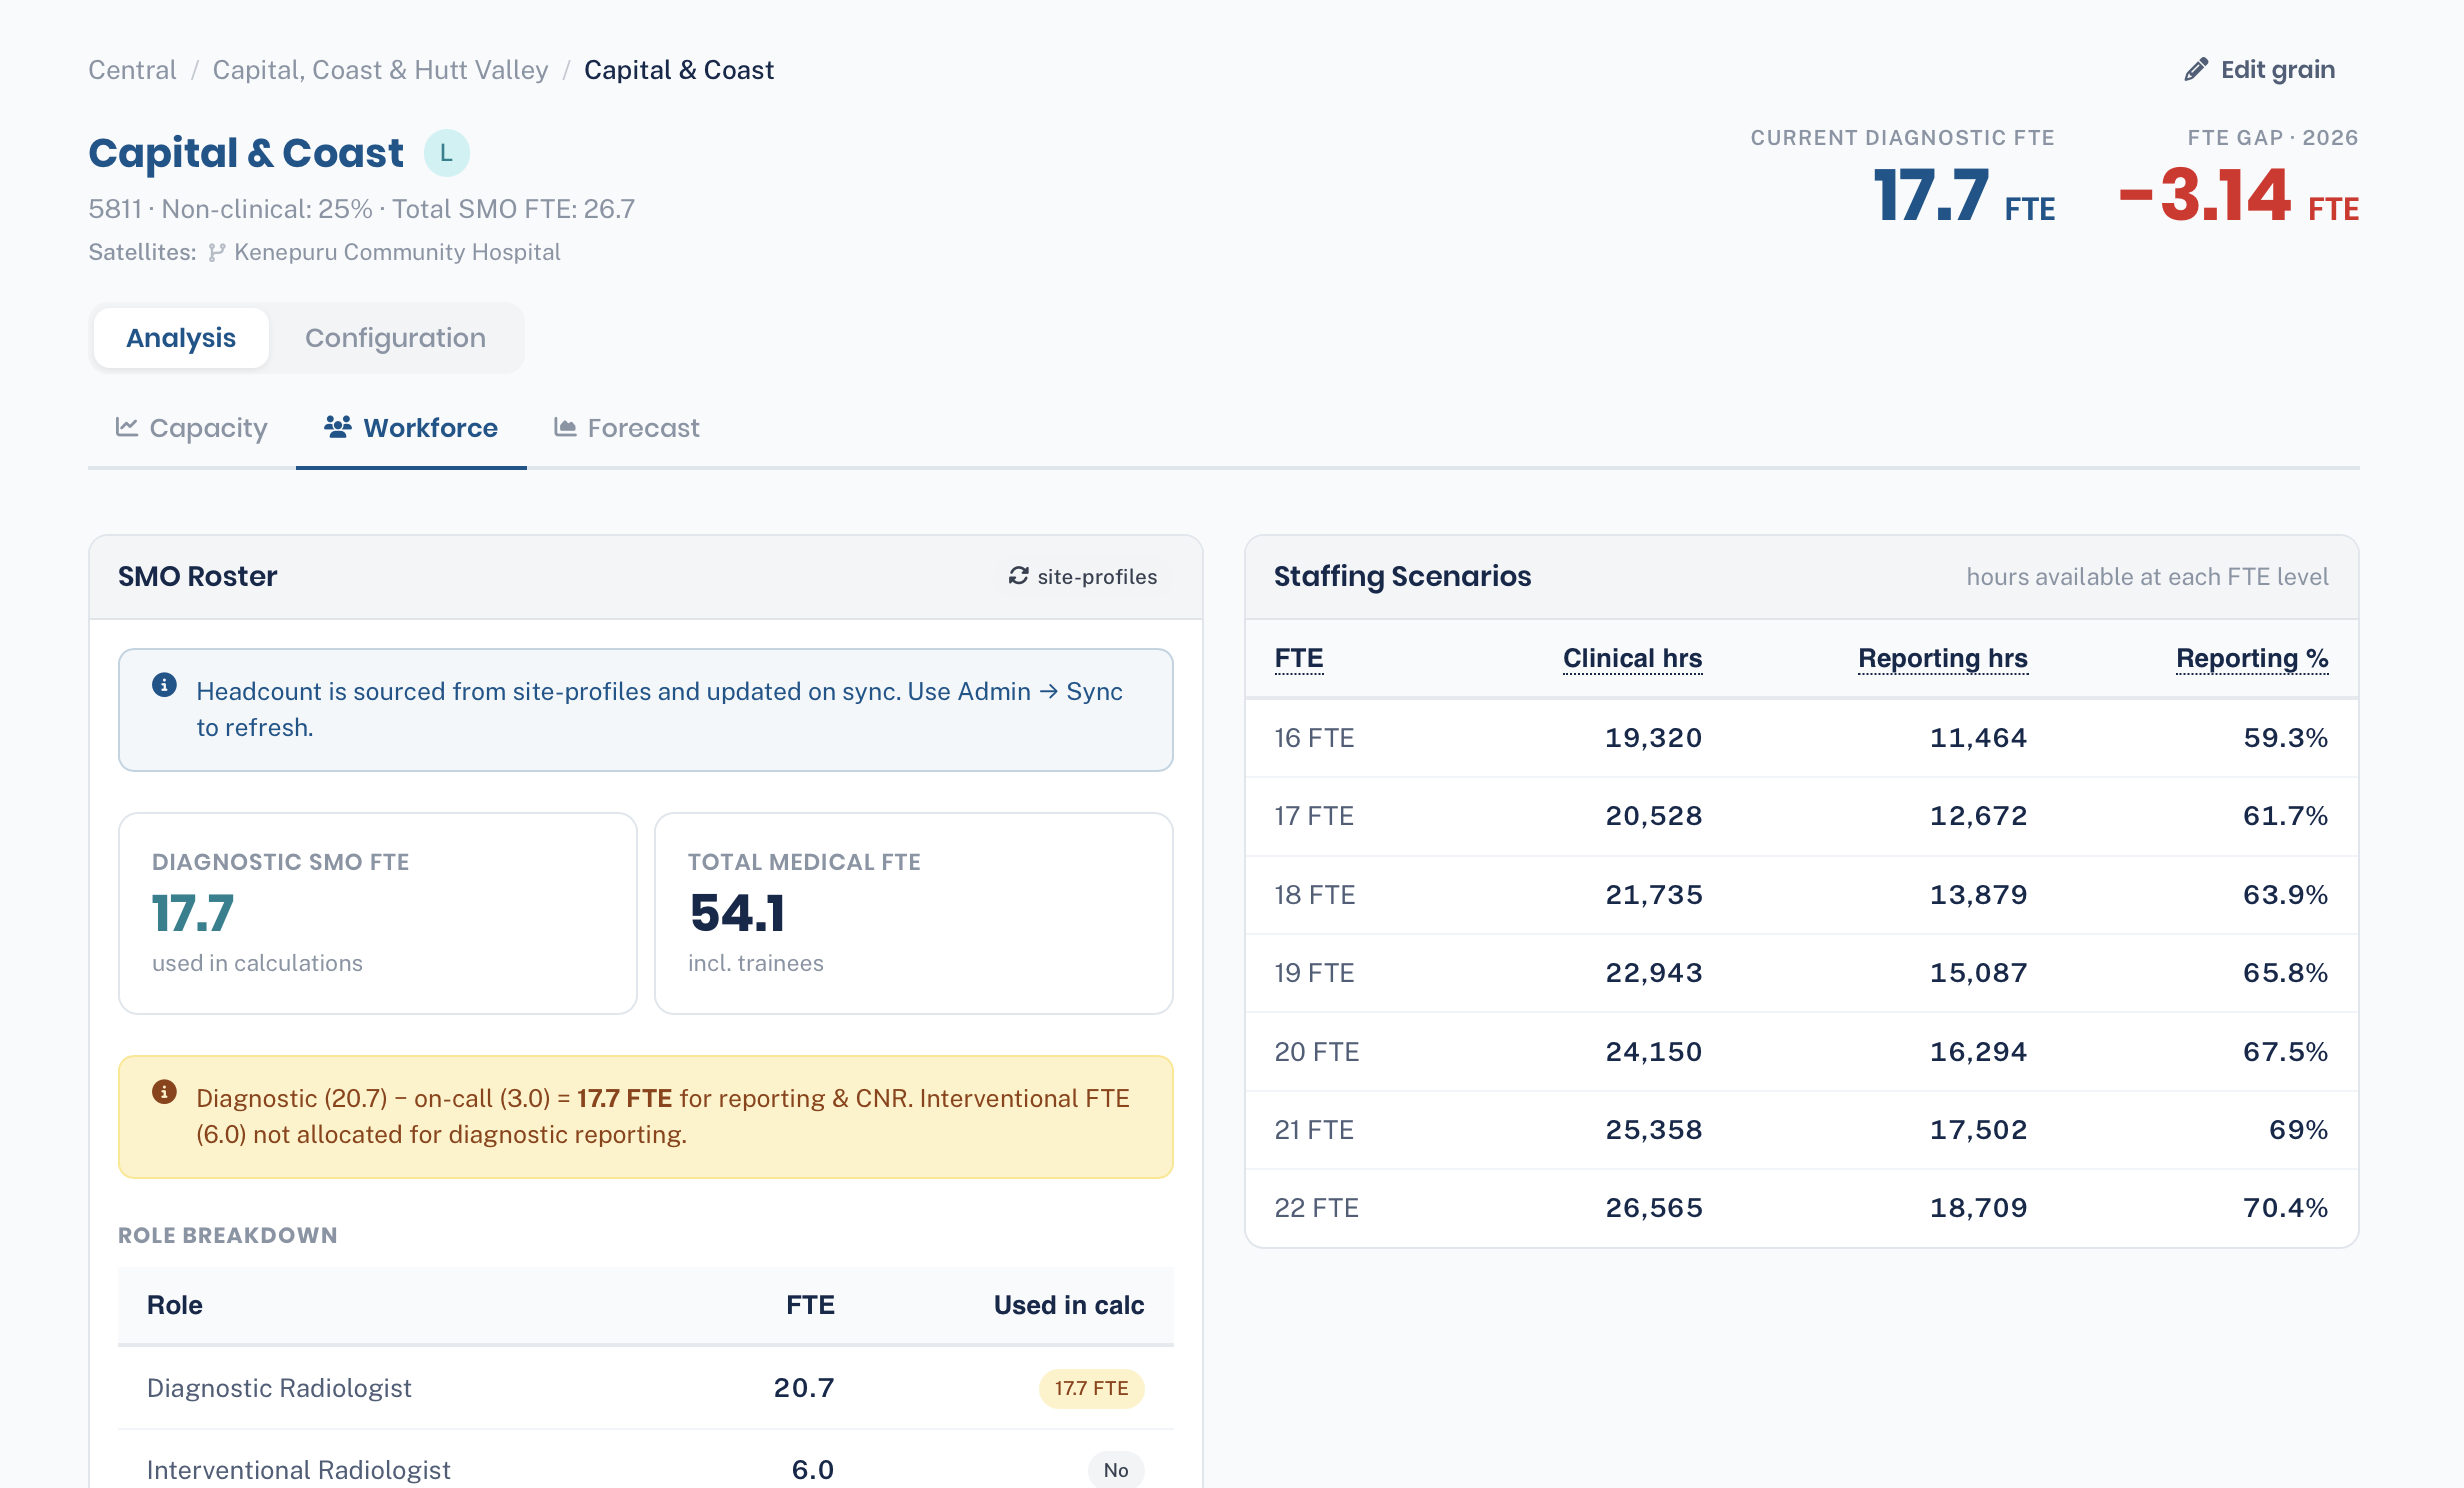
Workforce
The people side of the picture. The current SMO roster and role breakdown — diagnostic versus interventional radiologist FTE, and total medical FTE including trainees.
- The roster and role mix, with the diagnostic FTE that actually feeds the calculation clearly flagged.
- The on-call and interventional adjustments spelled out in plain language, so you can see how current FTE becomes effective FTE.
- A staffing-scenario table — clinical and reporting hours available at each FTE level.
- These figures are read-only here. They're synced from site-profiles; to change a roster, update it there and re-sync from the admin Sync screen.
Forecast
Projects the requirement forward. Runs the engine across future years using demand forecast scenarios — base, low and high — so workforce need can be planned ahead of demand.
- Base / low / high forecast bands
- Year-by-year detail of required FTE
- Turns this year's snapshot into a multi-year plan
The Configuration group holds every input the engine consumes. Editing here needs editor rights.
Baseline Volumes
The reporting volumes that drive workload. Enter annual examination counts per modality, split by complexity (simple / complex) and patient type (inpatient / outpatient), and record how much is read in-house versus outsourced.
- Enter simple and complex separately — each modality–complexity pair has its own minutes-per-report time constant, so the split changes the result.
- Outsourced volumes power the repatriation view on the Capacity tab — the requirement if that work were brought back in-house.
- Baseline volumes are used when a grain has no year-specific Demand Forecast; if a forecast exists for the year being viewed, it takes priority.
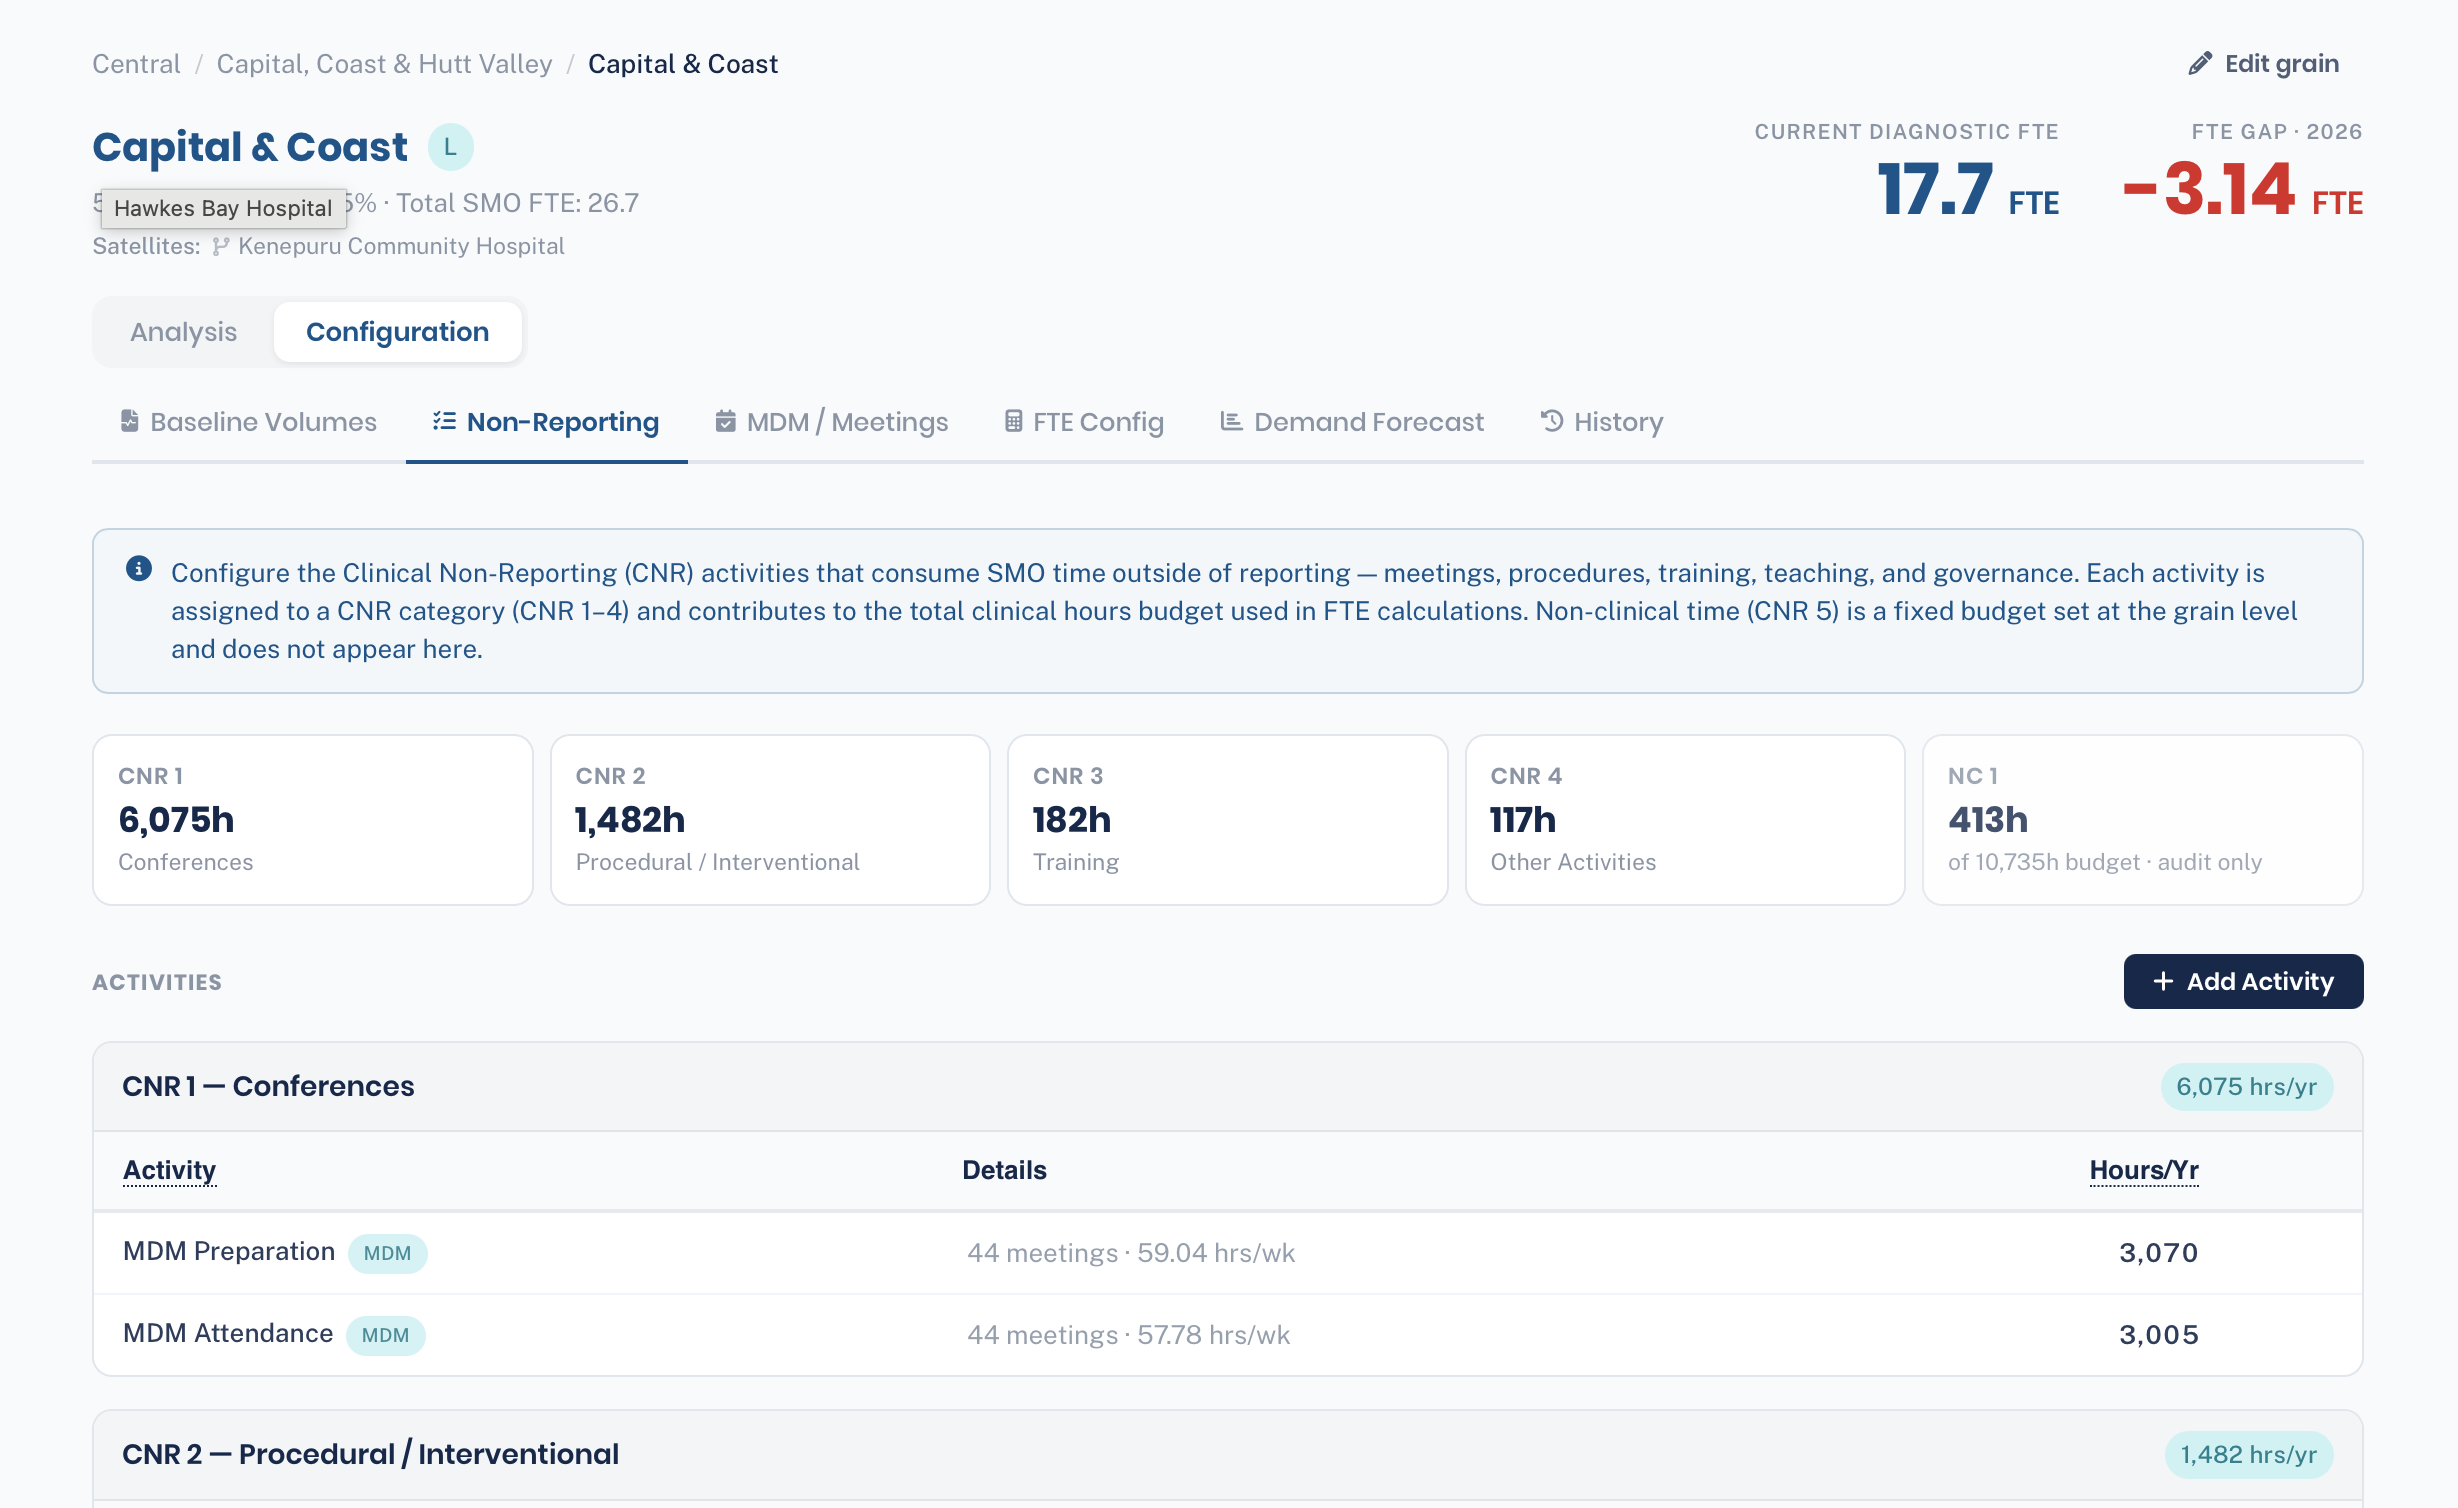
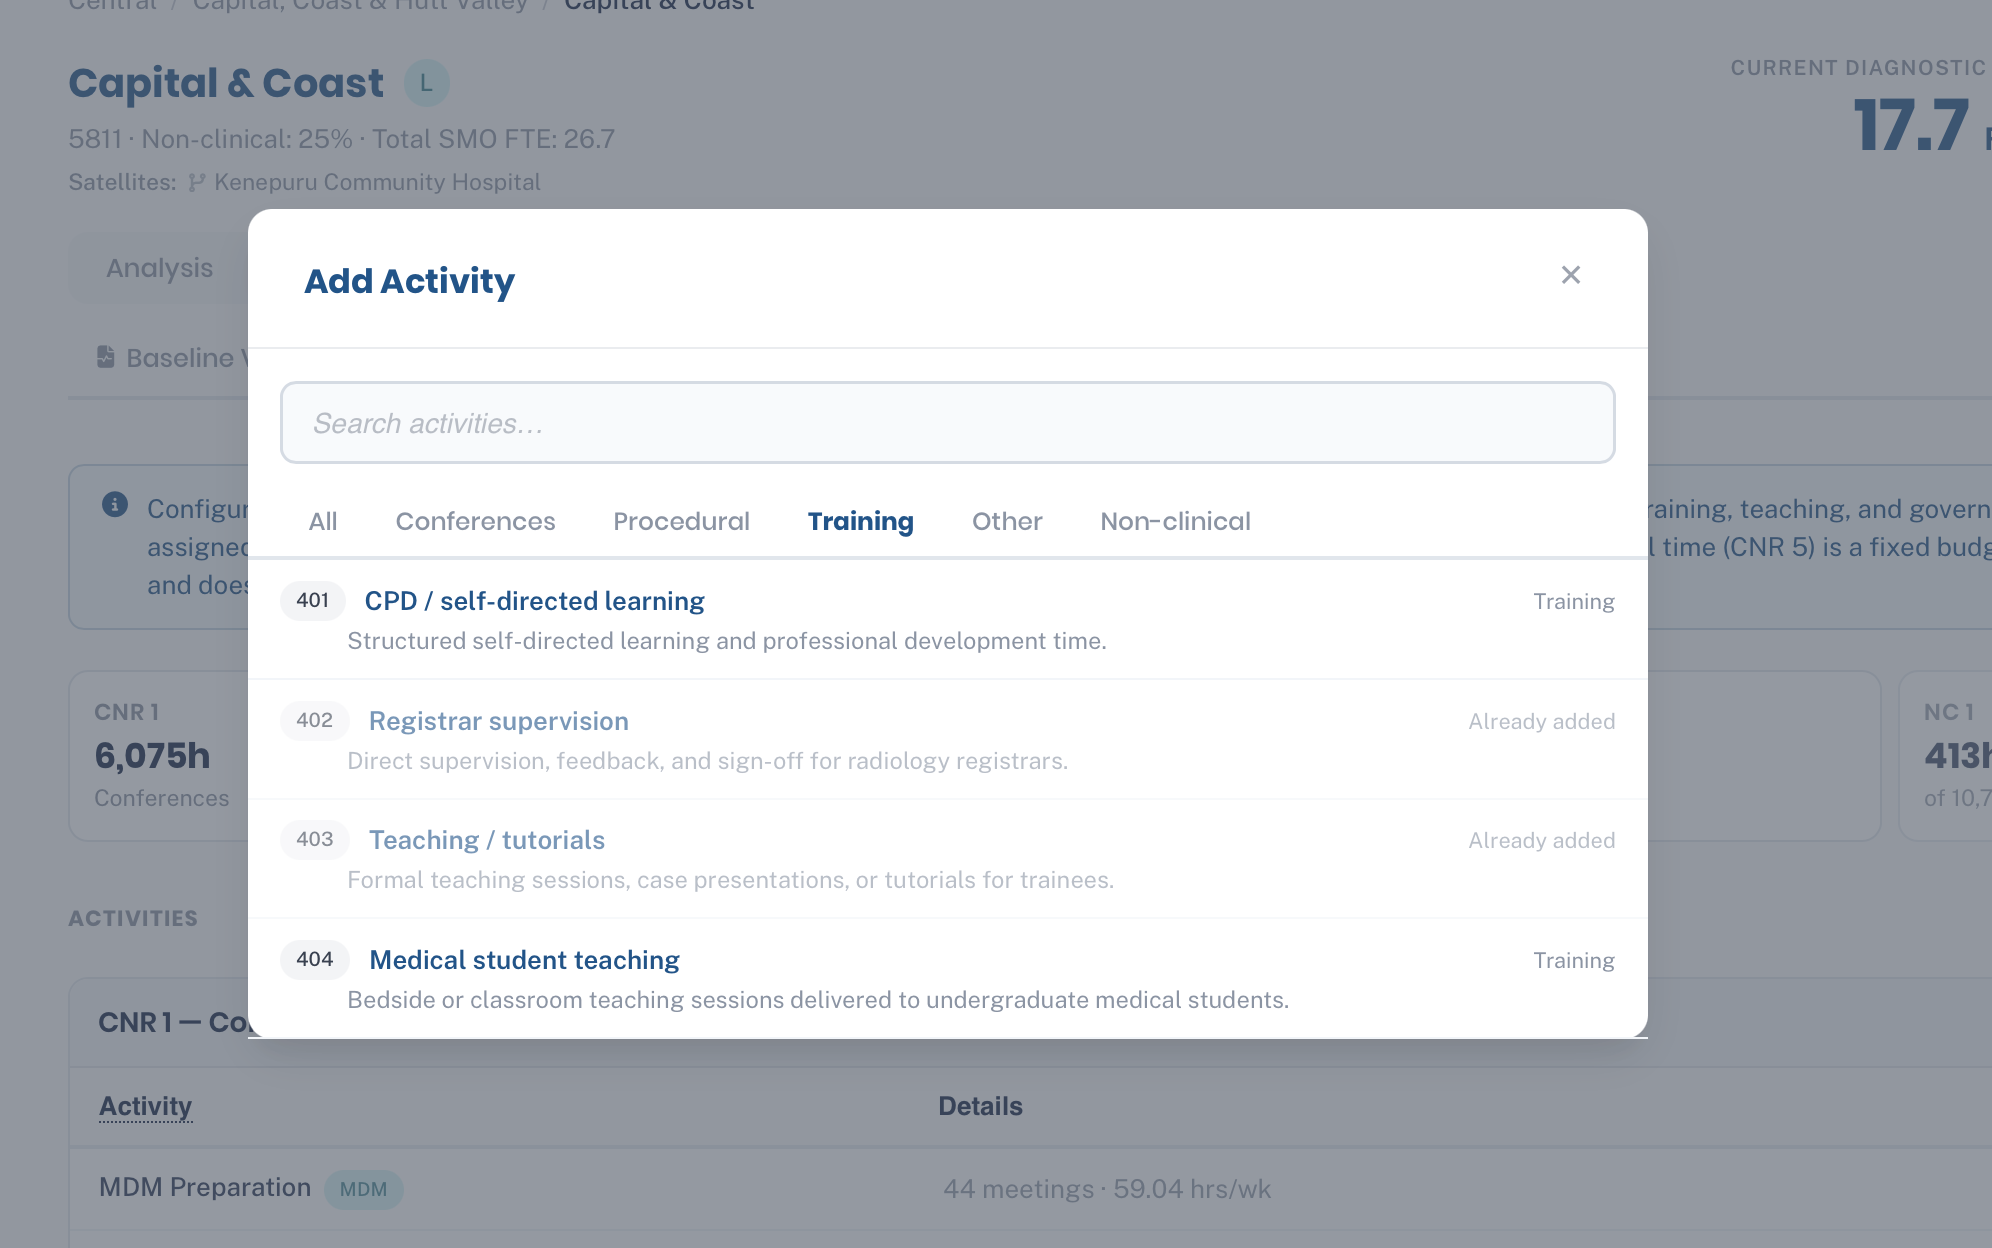
Non-Reporting (CNR)
Where you record every clinical task that isn't reporting. Use Add Activity to pull a standard task from the shared library — already filtered by category — or enter a custom one. Each activity needs a CNR category, a unit of measure, the time per unit in minutes, and an annual volume.
- Choose the category carefully: CNR 1 Conferences, CNR 2 Procedural / Interventional, CNR 3 Training or CNR 4 Other Activities.
- MDM preparation and attendance show here under CNR 1, but you set them up on the MDM / Meetings tab — don't re-enter them as activities.
- Non-clinical tasks can be listed for completeness, but they're audit-only and don't add to the calculated hours. Non-clinical time is set as a percentage on FTE Config.
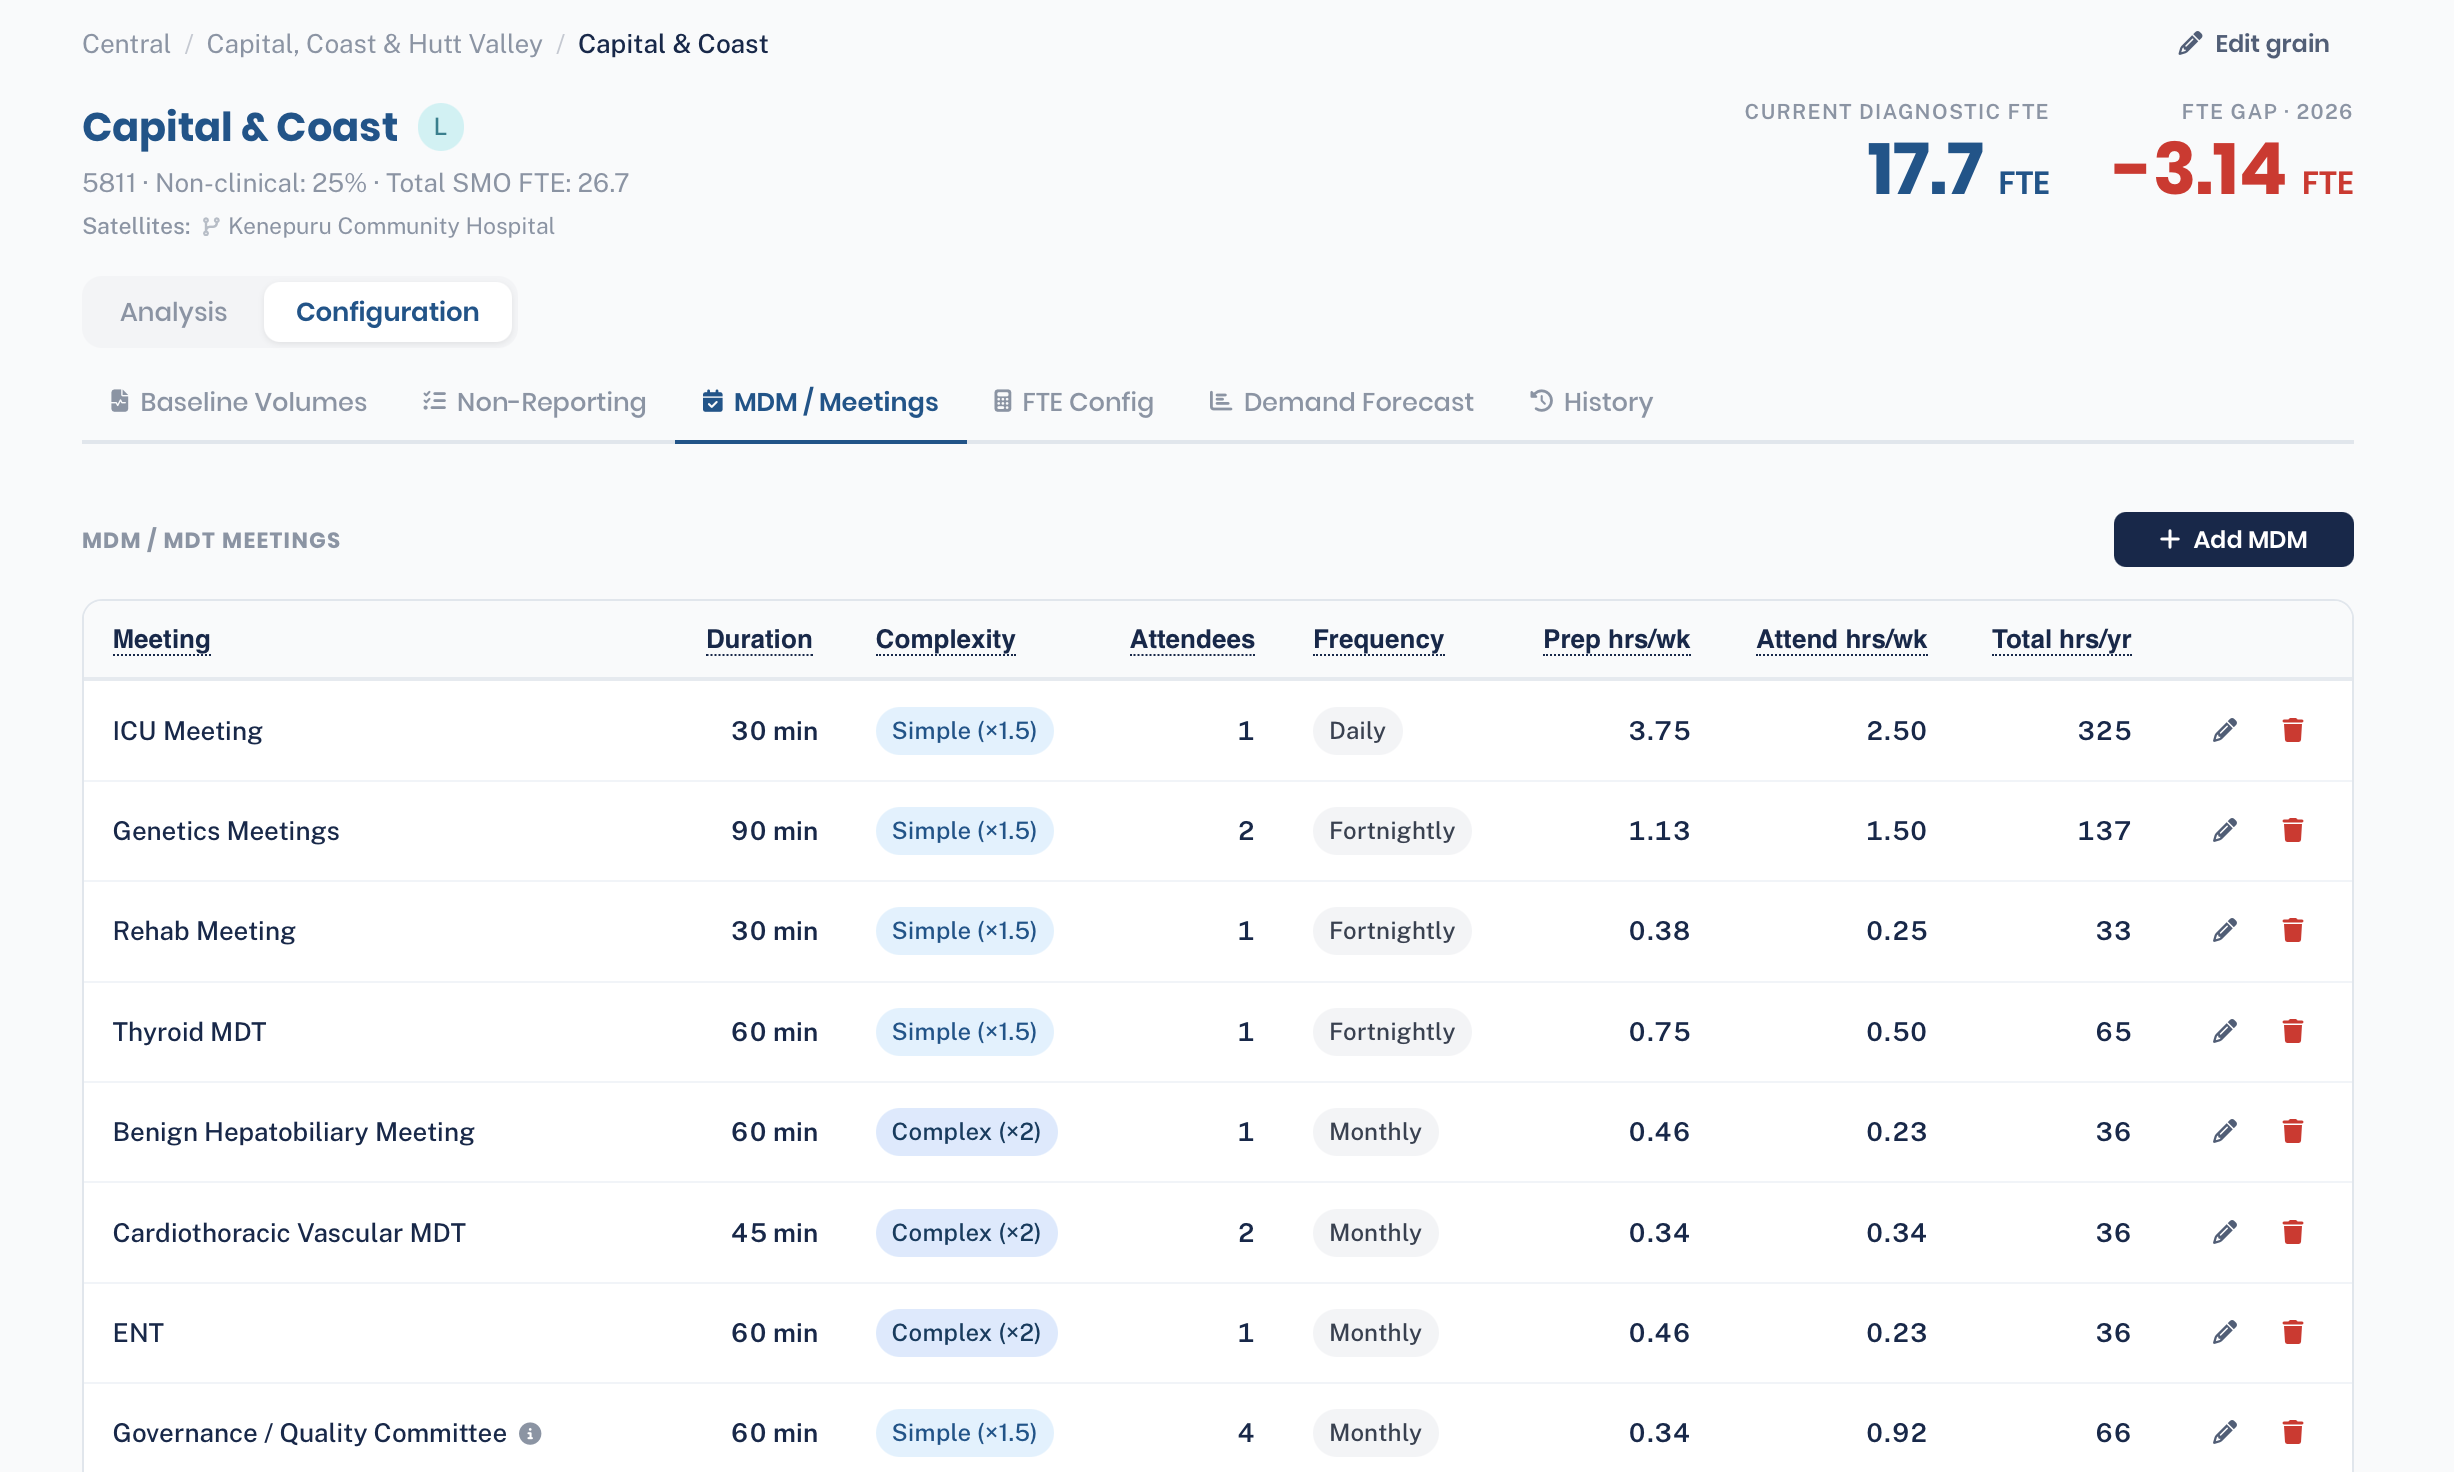
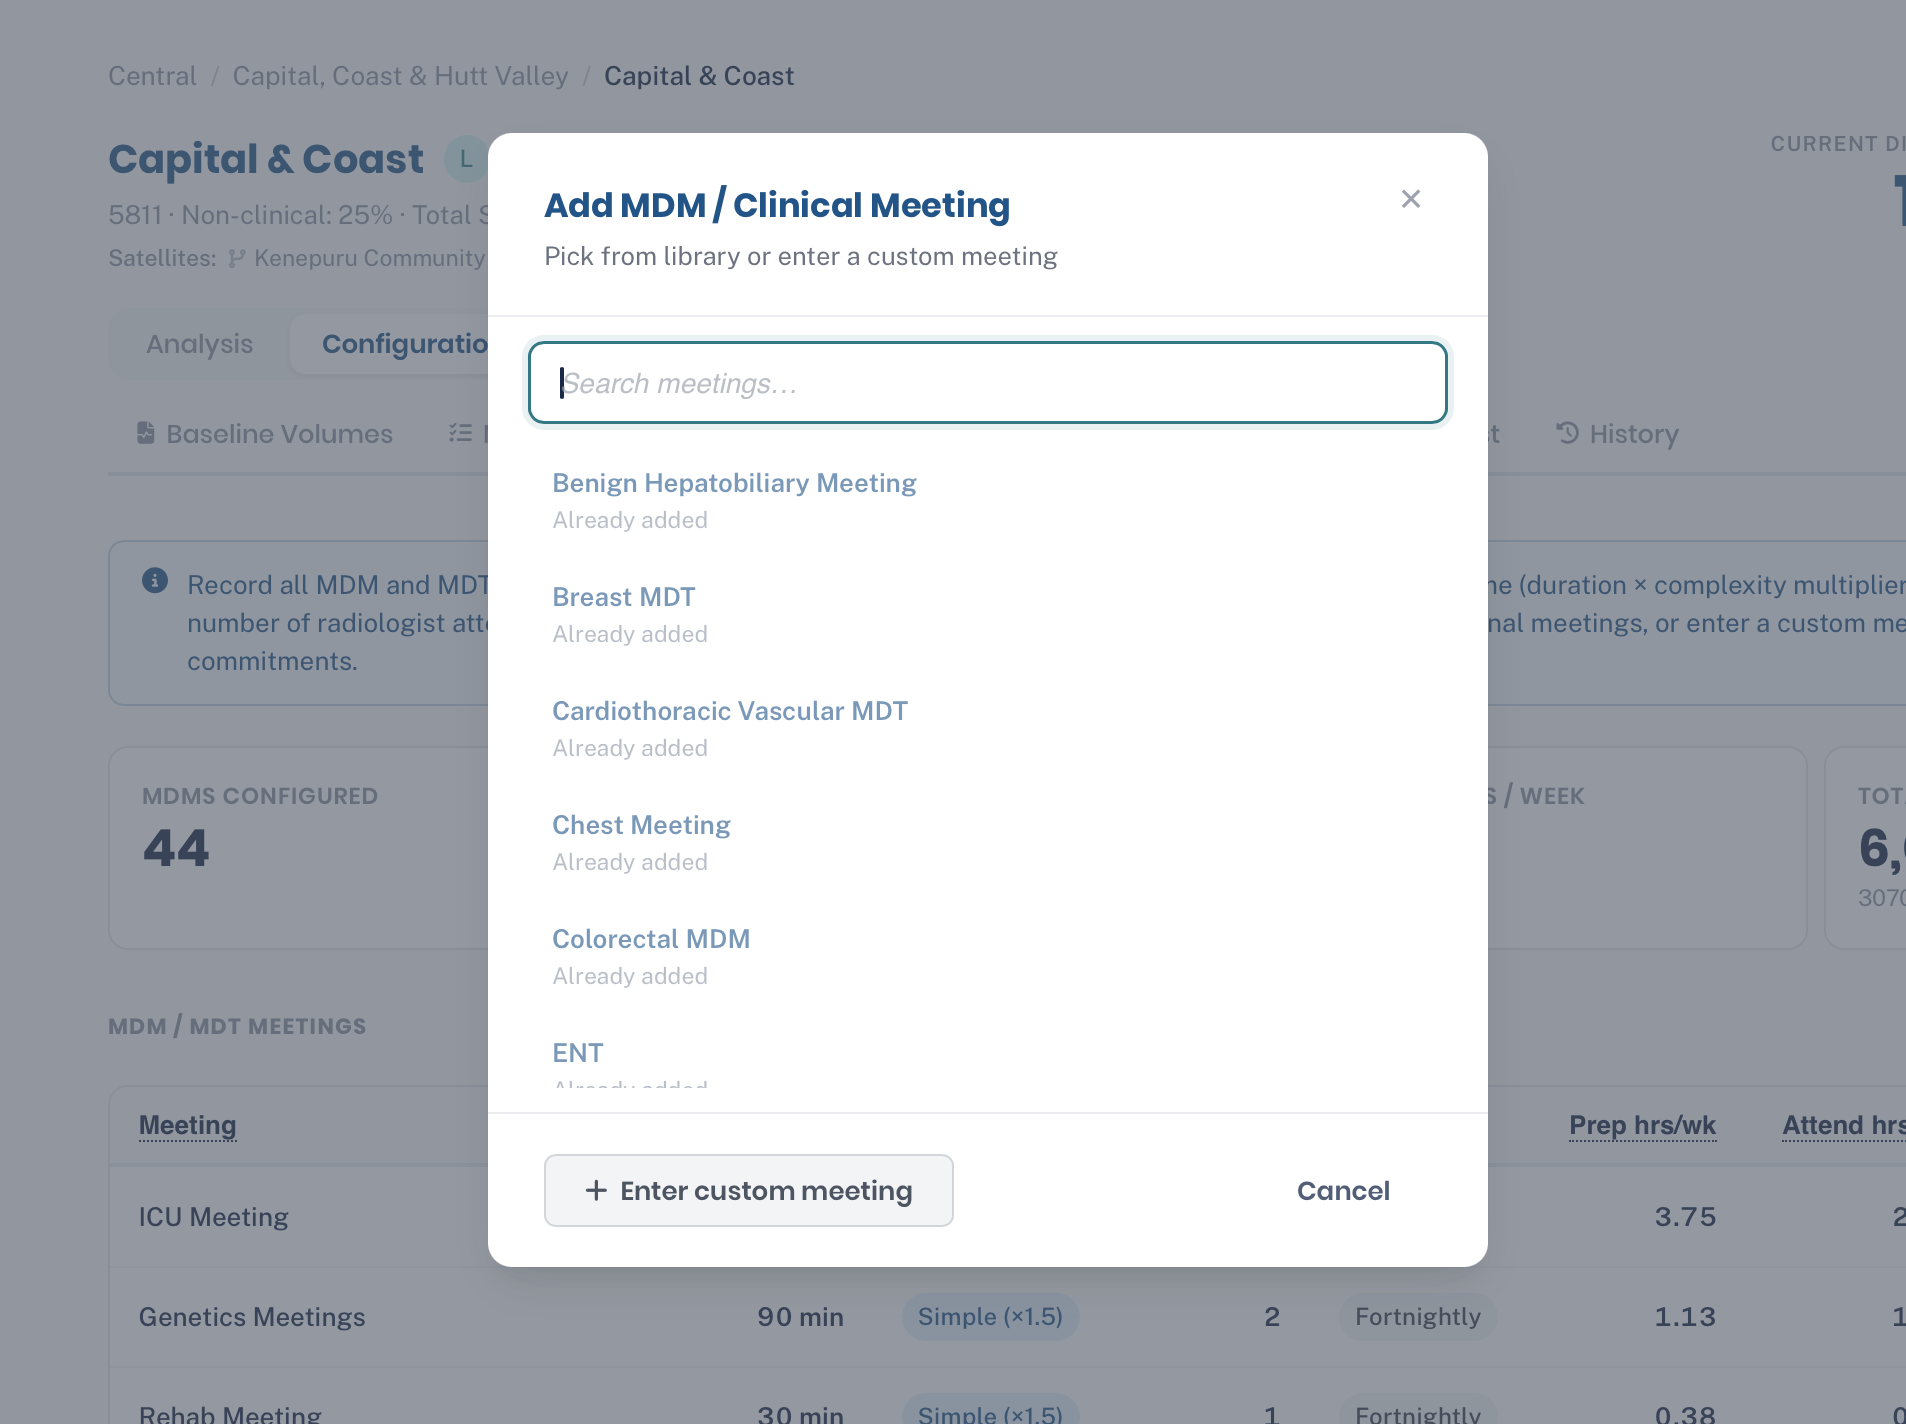
MDM / Meetings
Recurring multidisciplinary meetings. Add each meeting with its frequency, duration, complexity and attendee count — the tool works out the annual hours for you and rolls them into CNR 1 Conferences.
- Set frequency to daily, weekly, fortnightly or monthly — it scales the weekly figure to a yearly one.
- Attendee count multiplies attendance time, so a meeting with eight radiologists costs far more than a single-reviewer check — count only those who actually attend.
- Total hrs/yr is the figure that flows into the Capacity result.
FTE Config
Defines what one FTE is worth at this grain. Start from standard annual hours, then enter each leave deduction — annual leave, public holidays, training, sick and other. What's left is productive hours, shown live as you type.
- Set the non-clinical % to cover admin and support time that isn't itemised as activities elsewhere.
- On-call FTE is subtracted from diagnostic capacity — enter the FTE tied up in on-call rather than available for reporting.
- Interventional reporting allocation adds back the slice of IR radiologist time that does diagnostic reporting (capped at the grain's interventional FTE).
- Every field is per-grain, so a small rural service and a tertiary centre can carry different, defensible assumptions.
Demand Forecast
Forward-looking demand volumes by year and scenario. When present, these take priority over baseline volumes and power the Forecast tab. Set growth assumptions per modality across the planning horizon.
- Year- and scenario-specific volumes
- Drives multi-year required-FTE projections
- Primary volume source when configured
History
A full audit trail for the grain. Every change — who made it, when, and to what — so the numbers behind a business case can be defended and traced.
- Chronological change log
- Attributed to user email
- Transparency for governance and review
Library
The shared catalogue of activities and MDM meetings, with default values and archetype templates — so a new grain can be configured from sensible starting points rather than blank.
Time Constants
The national minutes-per-report figures for each modality and complexity. Change one here and every grain's reporting calculation moves with it.
CSV Upload
Bulk data import. Bring volumes and activity data in from spreadsheets with structured validation instead of typing into grids. Available to editors and admins.
Sync
Pulls the canonical facility, district, region and staffing data from site-profiles, keeping the hierarchy and roster figures current. Admin-only.
Two apps, one system
Service Sizing doesn't try to own everything. It pairs with site-profiles, the facility registry — a clean division of responsibility that keeps each side simple.
site-profiles
The source of truth for what exists:
- Regions, districts, facilities
- Archetypes and equipment
- Staffing headcount snapshots
- User login and identity
service-sizing
The source of truth for how much work:
- Grains and CNR activity profiles
- FTE configurations and non-clinical %
- Demand and reporting volumes
- The capacity calculation engine
Who can do what
Each signed-in user carries their role and region access with them, so permissions are checked instantly. Access can also be scoped to specific regions.
| Capability | Viewer | Editor | Admin |
|---|---|---|---|
| View overviews, capacity & forecasts | |||
| Compare grains & read history | |||
| Edit grain configuration & volumes | — | ||
| CSV bulk upload | — | ||
| Manage the shared Library | — | — | |
| Edit national Time Constants | — | — | |
| Sync from site-profiles | — | — |